Are you a member of the Splunk Community?
- Find Answers
- :
- Using Splunk
- :
- Splunk Search
- :
- Link to search in new tab
- Subscribe to RSS Feed
- Mark Topic as New
- Mark Topic as Read
- Float this Topic for Current User
- Bookmark Topic
- Subscribe to Topic
- Mute Topic
- Printer Friendly Page
- Mark as New
- Bookmark Message
- Subscribe to Message
- Mute Message
- Subscribe to RSS Feed
- Permalink
- Report Inappropriate Content
Link to search in new tab
Hi Team,
Link to search on a new tab for raw events when we click on a particular value in the line chart?
Is it possible?
- Mark as New
- Bookmark Message
- Subscribe to Message
- Mute Message
- Subscribe to RSS Feed
- Permalink
- Report Inappropriate Content
- Mark as New
- Bookmark Message
- Subscribe to Message
- Mute Message
- Subscribe to RSS Feed
- Permalink
- Report Inappropriate Content
Use below drilldown-
<option name="charting.drilldown">all</option>
 <drilldown>
      <link target="_blank">/app/myapp/mwdashboard</link>
 </drilldown>
- Mark as New
- Bookmark Message
- Subscribe to Message
- Mute Message
- Subscribe to RSS Feed
- Permalink
- Report Inappropriate Content
@493669
This is not what I am looking for, I have a line chart and when I would click on the line chart value then it should open up new tab which should show me the raw events.
It works fine, when I select auto option in drilldown for "link to search", however I want the same thing in new tab.
- Mark as New
- Bookmark Message
- Subscribe to Message
- Mute Message
- Subscribe to RSS Feed
- Permalink
- Report Inappropriate Content
try below- here replace query with your query-
<option name="charting.drilldown">all</option>
<drilldown>
<link target="_blank">search?q=index=_internal%20%7C%20stats%20count%20by%20sourcetype&earliest=-15m&latest=now</link>
</drilldown>
Below is sample dashboard on sampe data-
<dashboard>
<label>826404_line chart</label>
<row>
<panel>
<chart>
<search>
<query>index=_internal | stats count by sourcetype</query>
<earliest>-15m</earliest>
<latest>now</latest>
</search>
<!--drilldown>
<link target="_blank">/app/search/592973_multiselect_remove_all</link>
</drilldown-->
<option name="charting.chart">line</option>
<option name="charting.drilldown">all</option>
<drilldown>
<link target="_blank">search?q=index=_internal%20%7C%20stats%20count%20by%20sourcetype&earliest=-15m&latest=now</link>
</drilldown>
</chart>
</panel>
</row>
</dashboard>
- Mark as New
- Bookmark Message
- Subscribe to Message
- Mute Message
- Subscribe to RSS Feed
- Permalink
- Report Inappropriate Content
@493669
I am not looking for this, my query is different, if I click on a line chart value it should display only that events.
Regards,
Manish Singh
- Mark as New
- Bookmark Message
- Subscribe to Message
- Mute Message
- Subscribe to RSS Feed
- Permalink
- Report Inappropriate Content
at the end of query use event handler like $click.value$ which will help to display clicked event.
refer splunk docs-https://docs.splunk.com/Documentation/Splunk/8.0.4/Viz/EventHandlerReference#chart_(event_tokens)
- Mark as New
- Bookmark Message
- Subscribe to Message
- Mute Message
- Subscribe to RSS Feed
- Permalink
- Report Inappropriate Content
@493669
I tried click.value2 and click.name2 but the value is not getting passed when it is opening in the new tab. I have a line chart which has hosts and its error count. So when I click on line chart it should give me the raw events of that host only.
for example
index= abc sourcetype= access:logs|timechart count as error_count by host
Drilldown search: index= abc sourcetype= access:logs host=$click.value2$
- Mark as New
- Bookmark Message
- Subscribe to Message
- Mute Message
- Subscribe to RSS Feed
- Permalink
- Report Inappropriate Content
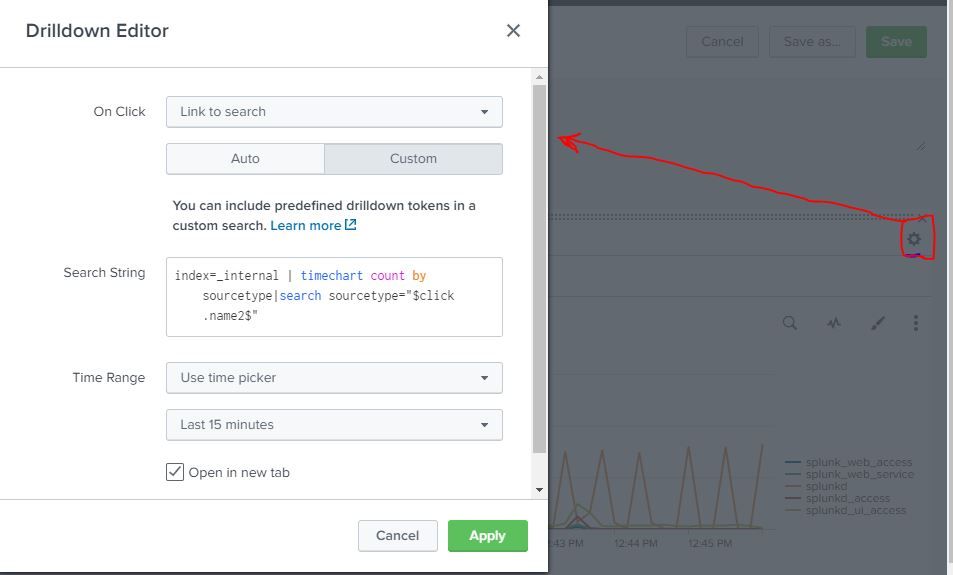
you will require to search host=$click.name2$
I have created sample dashboard and here on click it will open clicked sourcetype
Use below for reference-
<dashboard>
<label>826404_line chart</label>
<row>
<panel>
<chart>
<title>$abc$</title>
<search>
<query>index=_internal | timechart count by sourcetype</query>
<earliest>-15m</earliest>
<latest>now</latest>
</search>
<option name="charting.chart">line</option>
<option name="charting.drilldown">all</option>
<option name="refresh.display">progressbar</option>
<drilldown>
<link target="_blank">search?q=index=_internal%20%7C%20timechart%20count%20by%20sourcetype%7Csearch%20sourcetype=%22$click.name2$%22&earliest=-15m&latest=now</link>
</drilldown>
</chart>
</panel>
</row>
</dashboard>

