- Splunk Answers
- :
- Using Splunk
- :
- Splunk Search
- :
- Re: Last time a forwarder sent a log until now.
- Subscribe to RSS Feed
- Mark Topic as New
- Mark Topic as Read
- Float this Topic for Current User
- Bookmark Topic
- Subscribe to Topic
- Mute Topic
- Printer Friendly Page
- Mark as New
- Bookmark Message
- Subscribe to Message
- Mute Message
- Subscribe to RSS Feed
- Permalink
- Report Inappropriate Content
Hi there,
I am new to splunk. I and was wondering how to find the difference in time from the last time a forwarder sent a log until now and if the host has not sent a log in 5 min, set status to offline?
I am trying to achieve this Expected outcome of time comparison:
Thank you
- Mark as New
- Bookmark Message
- Subscribe to Message
- Mute Message
- Subscribe to RSS Feed
- Permalink
- Report Inappropriate Content
There is also another issue. And this is a general issue with splunk's event processing. Whereas some siem and log management solutions store various additional timestamps, splunk only stores _time (which is supposed to represent something called "event time" in some systems) and _indextime which is the timestamp at which the event was written do index. There is no information whatsoever about other stages of processing pipeline - you don't have the timestamp when it was received or read from the source, you don't know if it was queued on the forwarder or simply if the source has unsynchronized clock. You don't have this detailed info.
Therefore you might query for the _time but it might (and in general - should) be the timestamp parsed from the event itself. It might have nothing to do with when it was read/received and forwarded by forwarder. Especially with sources that do either batch log writing or inputs that do batch reading. For example - some configurations of WEC subscriptions can have up to 30 minutes synchronization delay. So your event might be half an hour old but still might have just been recently sent by the forwarder.
- Mark as New
- Bookmark Message
- Subscribe to Message
- Mute Message
- Subscribe to RSS Feed
- Permalink
- Report Inappropriate Content
Hi @My,
you could run something like this:
index=your_index
| stats latest(_time) AS latest count BY host
| eval
     diff=now()-latest,
     status=if(diff>300,"Offline","Online"),
latest=strftime(latest,"%Y-%m-%D %H:%M:%S")
| table host status latest diff
there's only one problem: in this way you can find only hosts that sent in the monitoring period, but if an host never sent an event, you haven't it in the above report.
To solve this problem, you have to create a llokup (called e.g. perimeter.csv) containing the hostname (field host) all the hosts to monitor and then run a search like this:
index=your_index
| eval host=lower(host)
| stats latest(_time) AS latest count BY host
| append [ | inputlookup perimeter.csv | eval host=lower(host), count=0 | fields host count ]
| stats values(_time) AS latest sum(count) AS total BY host
| eval
     diff=now()-latest,
     status=if(total=0,"never sent events",if(diff>300,"Offline","Online")),
     latest=strftime(latest,"%Y-%m-%D %H:%M:%S")
| table host status latest diff
Ciao.
Giuseppe
- Mark as New
- Bookmark Message
- Subscribe to Message
- Mute Message
- Subscribe to RSS Feed
- Permalink
- Report Inappropriate Content
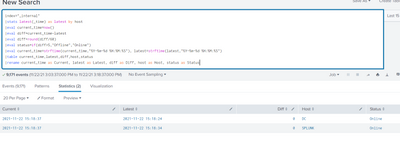
Thank you!
I was able to get the desired results with this,
- Mark as New
- Bookmark Message
- Subscribe to Message
- Mute Message
- Subscribe to RSS Feed
- Permalink
- Report Inappropriate Content
There is also another issue. And this is a general issue with splunk's event processing. Whereas some siem and log management solutions store various additional timestamps, splunk only stores _time (which is supposed to represent something called "event time" in some systems) and _indextime which is the timestamp at which the event was written do index. There is no information whatsoever about other stages of processing pipeline - you don't have the timestamp when it was received or read from the source, you don't know if it was queued on the forwarder or simply if the source has unsynchronized clock. You don't have this detailed info.
Therefore you might query for the _time but it might (and in general - should) be the timestamp parsed from the event itself. It might have nothing to do with when it was read/received and forwarded by forwarder. Especially with sources that do either batch log writing or inputs that do batch reading. For example - some configurations of WEC subscriptions can have up to 30 minutes synchronization delay. So your event might be half an hour old but still might have just been recently sent by the forwarder.


