Join the Conversation
- Find Answers
- :
- Using Splunk
- :
- Splunk Search
- :
- Is it Possible to create the Scatter_Line Chart in...
- Subscribe to RSS Feed
- Mark Topic as New
- Mark Topic as Read
- Float this Topic for Current User
- Bookmark Topic
- Subscribe to Topic
- Mute Topic
- Printer Friendly Page
- Mark as New
- Bookmark Message
- Subscribe to Message
- Mute Message
- Subscribe to RSS Feed
- Permalink
- Report Inappropriate Content
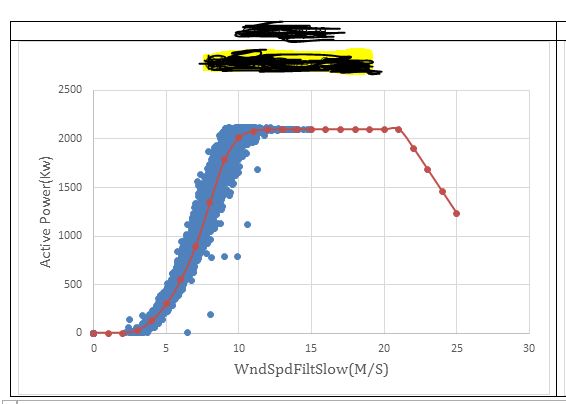
Is it Possible to create the Scatter_Line Chart in Splunk?
We have the Actual Generation Data from the Machine and also having the Set Points of the Particular Parameter.
we need to plot the set Points as a line chart as a Reference line and actual generation to be plot as a scatter plot in a one chart.
please find the below screenshot for your reference. the below chart was plotted in Ms-Excel. we need to plot this in Splunk.

- Mark as New
- Bookmark Message
- Subscribe to Message
- Mute Message
- Subscribe to RSS Feed
- Permalink
- Report Inappropriate Content
For now, how about presenting sample data?
- Mark as New
- Bookmark Message
- Subscribe to Message
- Mute Message
- Subscribe to RSS Feed
- Permalink
- Report Inappropriate Content
Hi @vengat4043,
There are multiple scatter charts available with Splunk. Have a look here :
https://docs.splunk.com/Documentation/Splunk/8.0.0/Viz/ScatterChart#Create_a_scatter_chart
And here :
https://docs.splunk.com/Documentation/MLApp/5.0.0/User/Customvisualizations#Scatter_Line_Chart
https://docs.splunk.com/Documentation/MLApp/5.0.0/User/Customvisualizations#3D_Scatter_Plot
https://docs.splunk.com/Documentation/MLApp/5.0.0/User/Customvisualizations#Scatterplot_Matrix
Let me know if that helps.
Cheers,
David
- Mark as New
- Bookmark Message
- Subscribe to Message
- Mute Message
- Subscribe to RSS Feed
- Permalink
- Report Inappropriate Content
Thanks for your input. But all the chart we tried.
the above mentioned chart has two data sets. Please let us know is it possible to combine two various types of chart as one in splunk?
- Mark as New
- Bookmark Message
- Subscribe to Message
- Mute Message
- Subscribe to RSS Feed
- Permalink
- Report Inappropriate Content
Hi @vengat4043,
Its currently not possible to combine multiple visualizations but you can build your own custom viz. Documentation is quite easy to understand and replicate. Have a look here :
https://docs.splunk.com/Documentation/Splunk/8.0.0/AdvancedDev/CustomVizTutorial

Join the Splunk Community Slack to learn, troubleshoot, and make connections with fellow Splunk practitioners in real time!
Join Splunk User Groups to connect and learn in-person by region or remotely by topic or industry.
Automated Threat Analysis: Available in ES Premier
What’s New in Splunk AI: Volume 02
Best Practices: Splunk auto adjust pipeline queue
