
Join the Conversation
- Find Answers
- :
- Using Splunk
- :
- Splunk Search
- :
- Re: How to use stack mode on a bar chart
- Subscribe to RSS Feed
- Mark Topic as New
- Mark Topic as Read
- Float this Topic for Current User
- Bookmark Topic
- Subscribe to Topic
- Mute Topic
- Printer Friendly Page
- Mark as New
- Bookmark Message
- Subscribe to Message
- Mute Message
- Subscribe to RSS Feed
- Permalink
- Report Inappropriate Content
How to use stack mode on a bar chart

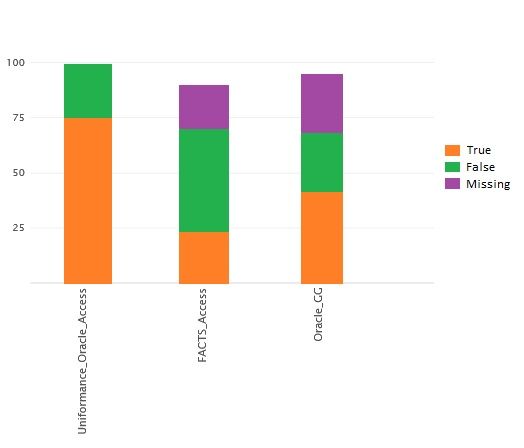
I have many Json that contains multiple fields such as:
{"FACTS Access":"True",
"FACTS Database Access":"True",
"Uniformance Oracle Access":"True",
"FACTS Lan Folder Access":"False",
"Uniformance Access":"True"}
Each of these fields support "TRUE"/"FALSE"/"MISSING" values.
What I need to do is create a dashboard as the one displayed above where the X axis is composed by Json fields and the Y axis is the count of each of the results these fields support.
- Mark as New
- Bookmark Message
- Subscribe to Message
- Mute Message
- Subscribe to RSS Feed
- Permalink
- Report Inappropriate Content

Try like this (select column chart with Stack Mode as 'stacked')
index=foo sourcetype=bar | table _raw | spath | fields - _raw | eval temp=1
| untable temp Metrics Value | chart count by Metrics Value
- Mark as New
- Bookmark Message
- Subscribe to Message
- Mute Message
- Subscribe to RSS Feed
- Permalink
- Report Inappropriate Content
I need each of the fields to be a column in the chart:
index=msahc | rex "(?{[^}]+})" | mvexpand json_field | spath input=json_field | search ACT | eval DateTime=_time | convert timeformat="%x" ctime(DateTime) | bucket DateTime span=1d | rename "Uniformance Oracle Access" as "Uniformance_Oracle_Access", "Uniformance Access" as "Uniformance_Access", "FACTS Access" as "FACTS_Access", "Oracle GG" as "Oracle_GG", "IDM Access" as "IDM_Access", "FACTS Database Access" as "FACTS_Database_Access", "FACTS Lan Folder Access" as "FACTS_Lan_Folder_Access" | table ServerName, Uniformance_Oracle_Access, Uniformance_Access, FACTS_Access, Oracle_GG, IDM_Access, FACTS_Database_Access, FACTS_Lan_Folder_Access
- Mark as New
- Bookmark Message
- Subscribe to Message
- Mute Message
- Subscribe to RSS Feed
- Permalink
- Report Inappropriate Content
Just add this to your current search.
your current search  | eval temp=1
 | untable temp Metrics Value | chart count by Metrics Value
- Mark as New
- Bookmark Message
- Subscribe to Message
- Mute Message
- Subscribe to RSS Feed
- Permalink
- Report Inappropriate Content
The stack mode is not the problem... The main problem is how to display Json fields in the X axis, the count of each of them in the Y axis (how many "FACTS Access" are true, for example) and the colors should be the values of each of them.



Join the Splunk Community Slack to learn, troubleshoot, and make connections with fellow Splunk practitioners in real time!
Join Splunk User Groups to connect and learn in-person by region or remotely by topic or industry.
Enriching Signals with the OTel Lookup Processor
Meet the .conf26 AI Agent Buildathon Winners
Painting a Clearer Picture: Unifying Your Investigations with Cisco AI Canvas
