Join the Conversation
- Find Answers
- :
- Using Splunk
- :
- Splunk Search
- :
- How to set up search query for port scanning?
- Subscribe to RSS Feed
- Mark Topic as New
- Mark Topic as Read
- Float this Topic for Current User
- Bookmark Topic
- Subscribe to Topic
- Mute Topic
- Printer Friendly Page
- Mark as New
- Bookmark Message
- Subscribe to Message
- Mute Message
- Subscribe to RSS Feed
- Permalink
- Report Inappropriate Content
How to set up search query for port scanning?
Hello!
I just set up Splunk Enterprise on-prem this morning and I was able to connect our Cisco Meraki firewall to Splunk using the UDP Data input (syslog). I am able to see all the traffic inbound/outbound and I would like to create an alert so that when a network port scan (like NMAP) is conducted internally I will be notified. I'm a little unsure what I need to input in the search box query?
For instance, I tried this in search: index=* sourcetype="syslog" src=172.30.0.0/21 dst=172.30.0.0/21 dport=22. It's pulling in some data from my test NMAP scan but it's only showing up as one scan from my kali Linux IP and the destination is the subnet gateway, it's not creating an entry for every host that was scanned.
Any suggestions on what I need to do?
- Mark as New
- Bookmark Message
- Subscribe to Message
- Mute Message
- Subscribe to RSS Feed
- Permalink
- Report Inappropriate Content
Firstly you should make sure that your source is properly onboarded.
I see a generic "syslog" sourcetype which most probably means that you don't have anything special configured for it, the extractions are just the automatic key/value pairs and there is no CIM compliance.
Even if it's good enough for now at least don't use a generic name which you'll use later for other different types of sources.
Having said that - are you sure your events are properly ingested? If you search for a single IP from those ranges that you're sure you've scanned - are they being returned as results?
Maybe you're not parsing the fields properly?
- Mark as New
- Bookmark Message
- Subscribe to Message
- Mute Message
- Subscribe to RSS Feed
- Permalink
- Report Inappropriate Content
Thank you for the suggestion @PickleRick, I updated it to sourcetype=meraki_syslog
I just ran this query: index=* sourcetype=meraki_syslog src=172.30.4.166
and I'm seeing all the live traffic, here's an example one:
Outbound: Jun 9 13:47:57 172.30.7.254 1 1654807677.409363608 meraki_firewall ip_flow_start src=172.30.4.166 dst=OUTBOUND_PUBLIC_IP protocol=tcp sport=40526 dport=443 translated_src_ip=OUR_EXTERNAL_BROADCAST_IP translated_port=40526
- host = 172.30.7.254
- source = udp:514
- sourcetype = meraki_syslog
I ran this query: index=* sourcetype=meraki_syslog src=172.30.0.0/21 dst=172.30.0.0/21
Internal: Jun 9 13:50:52 172.30.7.254 1 1654807852.363523623 meraki_firewall ip_flow_start src=172.30.4.89 dst=172.30.7.255 protocol=udp sport=43877 dport=15600 translated_dst_ip=172.30.7.255 translated_port=15600
- host = 172.30.7.254
- source = udp:514
- sourcetype = meraki_syslog
- Mark as New
- Bookmark Message
- Subscribe to Message
- Mute Message
- Subscribe to RSS Feed
- Permalink
- Report Inappropriate Content
Do a summary to see what you're getting in those events.
index=<your_index> sourcetype=syslog_meraki | stats values(src) values(dst)
And don't use index=*. For now if you don't have much data it might not incur a performance penalty but it's not a very good habit. Limit your searches to needed index(es) only.
- Mark as New
- Bookmark Message
- Subscribe to Message
- Mute Message
- Subscribe to RSS Feed
- Permalink
- Report Inappropriate Content
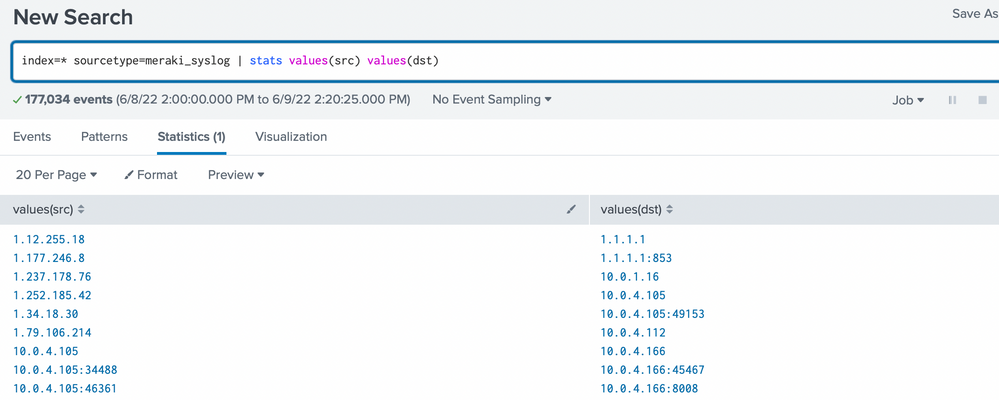
@PickleRick, I wasn't sure what to replace index=<your_index> with so I left index* 😐 but this is a sample output:
- Mark as New
- Bookmark Message
- Subscribe to Message
- Mute Message
- Subscribe to RSS Feed
- Permalink
- Report Inappropriate Content
Your data is in some index, so you should put the name of this index (I assume you're not ingesting it into multiple indexes).
Now you have a summary, you can see what values are there in your src and dst fields and if you get this range of yours at all.
You can play with this search to find if you have any events that match your ranges. Like:
index=<your_index> sourcetype=meraki_syslog src=172.30.0.0/21 dst=172.30.0.0/21
| stats values(src) values(dst) values(dport)
Or
index=<your_index> sourcetype=meraki_syslog src=172.30.0.0/21 dst=172.30.0.0/21
| stats count by src dst dport
- Mark as New
- Bookmark Message
- Subscribe to Message
- Mute Message
- Subscribe to RSS Feed
- Permalink
- Report Inappropriate Content
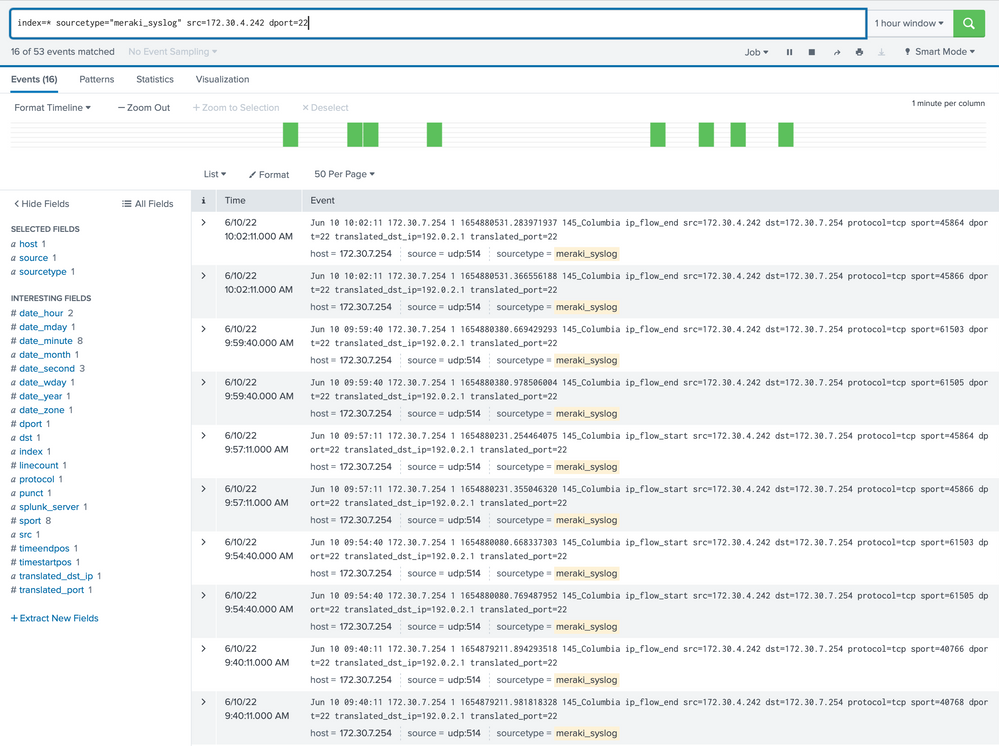
@PickleRickthanks for all the help so far, it definitely looks I'm not getting data to pull in 100% correctly. When I did NMAP for the entire subnet from my Kali box (172.30.4.244) it's only being represented as two scans each time, even though I'm scanning the entire /21 subnet for port 22, and it's showing the destination port as 254.


