Join the Conversation
- Find Answers
- :
- Using Splunk
- :
- Splunk Search
- :
- Re: How to plot a timechart for calculated value?
- Subscribe to RSS Feed
- Mark Topic as New
- Mark Topic as Read
- Float this Topic for Current User
- Bookmark Topic
- Subscribe to Topic
- Mute Topic
- Printer Friendly Page
- Mark as New
- Bookmark Message
- Subscribe to Message
- Mute Message
- Subscribe to RSS Feed
- Permalink
- Report Inappropriate Content
How to plot a timechart for calculated value?
Hi all,
I am calculating a value from data and i want to plot it in a timechart.
| where status!="ABORTED"
| streamstats count as start reset_on_change=true by status URL
| where start=1
| streamstats count(eval(status=="FAILURE")) as fails by status URL
| eval fails=if(fails=0,null(),fails)
| filldown fails
| stats list(*) as * by fails URL| where mvcount(status) = 2| eval stime=mvindex(TIME, 0) | eval etime=mvindex(TIME,-1) | eval diff=(etime - stime)/3600/1000|timechart span=1mon avg(diff) as MTTR by URL|eval MTTR = round(MTTR,2)
I tried to plot timechart like this but it is not working and it is giving no results found. Is there anything needs to be done to plot a calculated value in a timechart?
- Mark as New
- Bookmark Message
- Subscribe to Message
- Mute Message
- Subscribe to RSS Feed
- Permalink
- Report Inappropriate Content
You need to have a _time field in the data to be able to do timechart. If you set _time=stime, then you will at least get some data.
Also, you cannot do the MTTR rounding the way you are doing it, as there is no field as MTTR in a timechart when you split by a field. The columns will be named as the variants of JENKINS_URL
In order to round these, you need to have this logic to round unknown field names after the timechart
| foreach * [ eval "<<FIELD>>"=round('<<FIELD>>', 2) ]
- Mark as New
- Bookmark Message
- Subscribe to Message
- Mute Message
- Subscribe to RSS Feed
- Permalink
- Report Inappropriate Content
@bowesmanaThank you so much for the information. I will try to use that.
Is there any method so that i can get monthly wise data apart from timechart?
- Mark as New
- Bookmark Message
- Subscribe to Message
- Mute Message
- Subscribe to RSS Feed
- Permalink
- Report Inappropriate Content
Short answer - YES !
There are many ways to do almost anything in Splunk, but when dealing with time, there are typically 3 ways to do stats on time
timechart, stats and chart.
Naturally timechart is a simple way to produce time based information, but you can also use
| bin _time span=1mon
| stats count by _time
which will produce the same output as
| timechart span=1mon countwith a column called _time and a column called count
However, if you do
index=audit
| bin _time span=1h
| stats count by _time user
and
index=audit
| timechart span=1h count by user
You will see a very different row/column output.
timechart will have a column per user all on the same _time row, whereas stats will have 3 columns, _time, user and count, with a repeated time row per user.
So, really to answer your question, you should know what output information you want to achieve and then find the correct SPL to achieve that output.
- Mark as New
- Bookmark Message
- Subscribe to Message
- Mute Message
- Subscribe to RSS Feed
- Permalink
- Report Inappropriate Content
hi @bowesmana ,Thank you so much,
I tried,
| bin _time span=1mon
| stats count by _time user
I am able to create a chart, but the span is not considered as 1 month, instead it is taking random spans and giving values. Is there any different way to specify span?
- Mark as New
- Bookmark Message
- Subscribe to Message
- Mute Message
- Subscribe to RSS Feed
- Permalink
- Report Inappropriate Content
I'm not sure how you can be getting random spans, as that bin command will bin by a 1 month span and in your statistics tab you will have the _time column showing YYYY-MM (year/month)
Can you post your search and output
- Mark as New
- Bookmark Message
- Subscribe to Message
- Mute Message
- Subscribe to RSS Feed
- Permalink
- Report Inappropriate Content
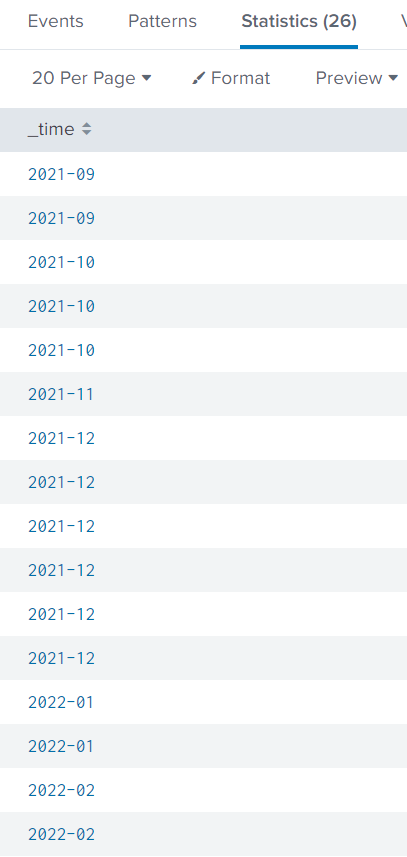
Hi @bowesmana I got the time field like this.
- Mark as New
- Bookmark Message
- Subscribe to Message
- Mute Message
- Subscribe to RSS Feed
- Permalink
- Report Inappropriate Content
There is nothing wrong with that set of dates, I assume there is a user against each row.
Is there a reason why you don't use timechart?
When you use bin+stats then it will not give months where there is no data for a user - it would be better to use timechart.
You can use 'makecontinous' command to fill in the 'gaps' but using timechart is the right solution

