
Join the Conversation
- Find Answers
- :
- Using Splunk
- :
- Splunk Search
- :
- Re: How to overlap two bars in a Splunk chart?
- Subscribe to RSS Feed
- Mark Topic as New
- Mark Topic as Read
- Float this Topic for Current User
- Bookmark Topic
- Subscribe to Topic
- Mute Topic
- Printer Friendly Page
- Mark as New
- Bookmark Message
- Subscribe to Message
- Mute Message
- Subscribe to RSS Feed
- Permalink
- Report Inappropriate Content

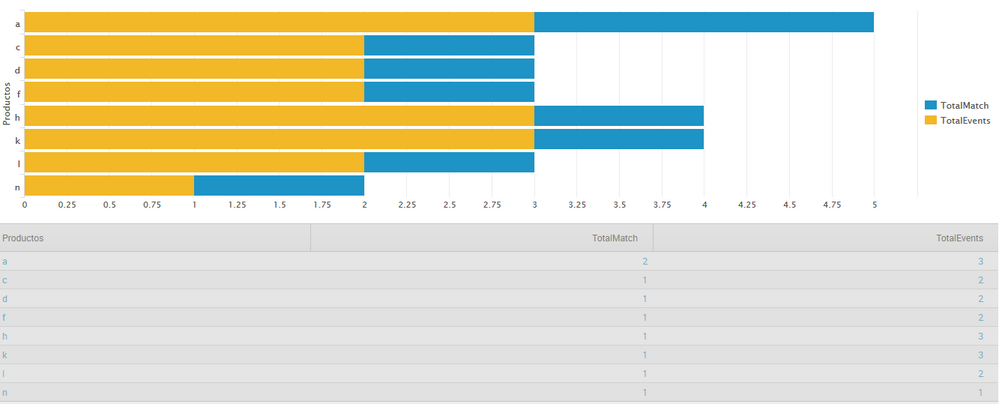
I have this search that counts the times a product has been purchased and the times the same product has been purchased with some other product, in this case product m.
I want to overlap the TotalEvents upon the TotalMatchs, but the option of stacked bars is just adding up the 2 fields.
Can someone help me please?
index=main sourcetype=csv source="reglas2.csv" Productos!=m [ search index=main sourcetype=csv source="reglas2.csv" Productos!=m [search index=main sourcetype=csv source="reglas2.csv" Productos=m | fields Id_Transaccion] | fields Productos ] | stats count as TotalEvents by Productos | appendcols [search index=main sourcetype=csv source="reglas2.csv" Productos!=m [search index=main sourcetype=csv source="reglas2.csv" Productos=m | fields Id_Transaccion] | stats count as TotalMatch by Productos]|table Productos TotalMatch TotalEvents
- Mark as New
- Bookmark Message
- Subscribe to Message
- Mute Message
- Subscribe to RSS Feed
- Permalink
- Report Inappropriate Content

If you really need to use bar charts, you could try to "cheat" by substracting the field TotalMatch from TotalEvents, and then stacking the fields. In this case you would see correct graphics, but your table results are wrong.
Just for the visualisation it can be a usable method still...
index=main sourcetype=csv source="reglas2.csv" Productos!=m [ search index=main sourcetype=csv source="reglas2.csv" Productos!=m [search index=main sourcetype=csv source="reglas2.csv" Productos=m | fields Id_Transaccion] | fields Productos ] | stats count as TotalEvents by Productos | appendcols [search index=main sourcetype=csv source="reglas2.csv" Productos!=m [search index=main sourcetype=csv source="reglas2.csv" Productos=m | fields Id_Transaccion] | stats count as TotalMatch by Productos] | eval TotalEvents = TotalEvents - TotalMatch |table Productos TotalMatch TotalEvents
- Mark as New
- Bookmark Message
- Subscribe to Message
- Mute Message
- Subscribe to RSS Feed
- Permalink
- Report Inappropriate Content
If you really need to use bar charts, you could try to "cheat" by substracting the field TotalMatch from TotalEvents, and then stacking the fields. In this case you would see correct graphics, but your table results are wrong.
Just for the visualisation it can be a usable method still...
index=main sourcetype=csv source="reglas2.csv" Productos!=m [ search index=main sourcetype=csv source="reglas2.csv" Productos!=m [search index=main sourcetype=csv source="reglas2.csv" Productos=m | fields Id_Transaccion] | fields Productos ] | stats count as TotalEvents by Productos | appendcols [search index=main sourcetype=csv source="reglas2.csv" Productos!=m [search index=main sourcetype=csv source="reglas2.csv" Productos=m | fields Id_Transaccion] | stats count as TotalMatch by Productos] | eval TotalEvents = TotalEvents - TotalMatch |table Productos TotalMatch TotalEvents
- Mark as New
- Bookmark Message
- Subscribe to Message
- Mute Message
- Subscribe to RSS Feed
- Permalink
- Report Inappropriate Content
Thanks DMohn,as you said it, the calculations will be wrong, although the chart will look good.
But what i am trying to do here is a market basket analisys, so i need to show the correct times a product has been purchased (TotalEvents) and the times a product has been purchased with other product (TotalMatch)
- Mark as New
- Bookmark Message
- Subscribe to Message
- Mute Message
- Subscribe to RSS Feed
- Permalink
- Report Inappropriate Content
Where shall these numbers be used? Is there a chance to include a table and a visualisation?
In this case you can introduce a temporary field like eval DisplayTotalEvents = TotalEvents - TotalMatch for the bar chart, and use the correct total fields for the table...
- Mark as New
- Bookmark Message
- Subscribe to Message
- Mute Message
- Subscribe to RSS Feed
- Permalink
- Report Inappropriate Content
It could be an option, Thanks
- Mark as New
- Bookmark Message
- Subscribe to Message
- Mute Message
- Subscribe to RSS Feed
- Permalink
- Report Inappropriate Content

Try area chart?
- Mark as New
- Bookmark Message
- Subscribe to Message
- Mute Message
- Subscribe to RSS Feed
- Permalink
- Report Inappropriate Content
I already tried the area chart and it does overlap, but i want the same result in a bar chart



Join the Splunk Community Slack to learn, troubleshoot, and make connections with fellow Splunk practitioners in real time!
Join Splunk User Groups to connect and learn in-person by region or remotely by topic or industry.
Data Management Digest – August 2026
Your Feedback. Our Roadmap. Visit the PX Feedback Booth at .conf26
Agentic SOC Triage: Investigating Splunk ES Notables with MCP Server and a Local LLM
