
Join the Conversation
- Find Answers
- :
- Using Splunk
- :
- Splunk Search
- :
- How to hide X axis scale in a bar chart
- Subscribe to RSS Feed
- Mark Topic as New
- Mark Topic as Read
- Float this Topic for Current User
- Bookmark Topic
- Subscribe to Topic
- Mute Topic
- Printer Friendly Page
- Mark as New
- Bookmark Message
- Subscribe to Message
- Mute Message
- Subscribe to RSS Feed
- Permalink
- Report Inappropriate Content

Hi,
I am unable to hide the X-axis scale in the bar chart. See below screenshot,
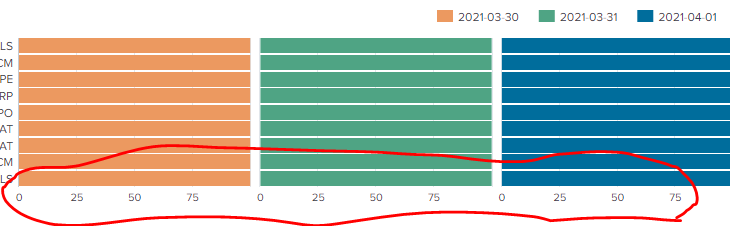
I am plotting the chart using below query, where date is a dated field in my logs and name is name for something.
index=* "some splunk query" | chart count(date) by name date
Below are my charting options. I have tried multiple options here as you see below but none of it is actually helping me to hide the X-axis scale.
<option name="charting.axisTitleX.visibility">collapsed</option>
<option name="charting.axisLabelsX.majorTickVisibility">hide</option>
<option name="charting.axisTitleY.visibility">collapsed</option>
<option name="charting.axisTitleY2.visibility">visible</option>
<option name="charting.axisLabelsY.majorTickVisibility">hide</option>
<option name="charting.axisLabelsY2.majorTickVisibility">hide</option>
<option name="charting.axisY.scale">linear</option>
<option name="charting.chart">bar</option>
<option name="charting.chart.showDataLabels">none</option>
<option name="charting.chart.stackMode">stacked100</option>
<option name="charting.drilldown">none</option>
<option name="charting.layout.splitSeries">1</option>
<option name="charting.layout.splitSeries.allowIndependentYRanges">0</option>
<option name="charting.legend.placement">top</option>
<option name="height">229</option>
<option name="refresh.display">progressbar</option>
</chart>
Can someone please help ?
Thanks in advance
- Mark as New
- Bookmark Message
- Subscribe to Message
- Mute Message
- Subscribe to RSS Feed
- Permalink
- Report Inappropriate Content


You should check (with inspect) what classes are used for the group (<g>) element in the svg and potentially hide it in a style panel e.g.
    <panel depends="$stayhidden$">
      <title>Colour based on previous</title>
      <html>
        <style>
          #yourchart g.highcharts-xaxis-labels{
            display: none;
          }
        </style>
      </html>
    </panel>
    <panel>
<chart id="yourchart">- Mark as New
- Bookmark Message
- Subscribe to Message
- Mute Message
- Subscribe to RSS Feed
- Permalink
- Report Inappropriate Content
@ITWhisperer , Any advise ?
- Mark as New
- Bookmark Message
- Subscribe to Message
- Mute Message
- Subscribe to RSS Feed
- Permalink
- Report Inappropriate Content
You should check (with inspect) what classes are used for the group (<g>) element in the svg and potentially hide it in a style panel e.g.
    <panel depends="$stayhidden$">
      <title>Colour based on previous</title>
      <html>
        <style>
          #yourchart g.highcharts-xaxis-labels{
            display: none;
          }
        </style>
      </html>
    </panel>
    <panel>
<chart id="yourchart">- Mark as New
- Bookmark Message
- Subscribe to Message
- Mute Message
- Subscribe to RSS Feed
- Permalink
- Report Inappropriate Content
Thanks a lot 🙂 It has helped
Though I struggled a bit to find where exactly this code should be placed in the xml, maybe as I am new to this 🙂 I put it below anyway just if it helps anyone.
Also, for reference on how to check in "Inspect/Developers Tool" see below link
<row>
<panel>
<html depends="$alwaysHideCSSStyleHTML$">
<style>
#chart5 g.highcharts-yaxis-labels{
display: none;
}
</style>
</html>
<chart id="chart5">
<title> HI </title>
<search base="base">
<query> my search query </query>
</search>
<option name="charting.axisTitleX.visibility">collapsed</option>
<option name="charting.axisTitleY.visibility">collapsed</option>
<option name="charting.axisTitleY2.visibility">visible</option>
<option name="charting.axisY.scale">linear</option>
<option name="charting.chart">bar</option>
<option name="charting.chart.showDataLabels">none</option>
<option name="charting.chart.stackMode">stacked100</option>
<option name="charting.drilldown">none</option>
<option name="charting.layout.splitSeries">1</option>
<option name="charting.layout.splitSeries.allowIndependentYRanges">0</option>
<option name="charting.legend.placement">top</option>
<option name="height">229</option>
<option name="refresh.display">progressbar</option>
</chart>
</panel>
</row>
- Mark as New
- Bookmark Message
- Subscribe to Message
- Mute Message
- Subscribe to RSS Feed
- Permalink
- Report Inappropriate Content
I usually find that putting the styling html in a separate panel (as in my example) works best (as it doesn't take up any extra screen real estate), but if the way you have done it works, that's fine too. 😀

Join the Splunk Community Slack to learn, troubleshoot, and make connections with fellow Splunk practitioners in real time!
Join Splunk User Groups to connect and learn in-person by region or remotely by topic or industry.
Agent Mode Engaged! Enchaining Agentic Operations with Splunk AI Assistant 2.0
Announcing Modern Navigation: A New Era of Splunk User Experience
Modernize your Splunk Apps – Introducing Python 3.13 in Splunk
