- Find Answers
- :
- Using Splunk
- :
- Splunk Search
- :
- Re: How to get timestamps from first and last tran...
- Subscribe to RSS Feed
- Mark Topic as New
- Mark Topic as Read
- Float this Topic for Current User
- Bookmark Topic
- Subscribe to Topic
- Mute Topic
- Printer Friendly Page
- Mark as New
- Bookmark Message
- Subscribe to Message
- Mute Message
- Subscribe to RSS Feed
- Permalink
- Report Inappropriate Content
How to get timestamps from first and last transaction events to calculate the time difference in hours?
I have multiple events in a server that I would like to get the timestamp from the very first transaction and the timestamp from the very last transaction for each feature, then get the timestamp difference between them in hours, in a table format.
My Json looks like:
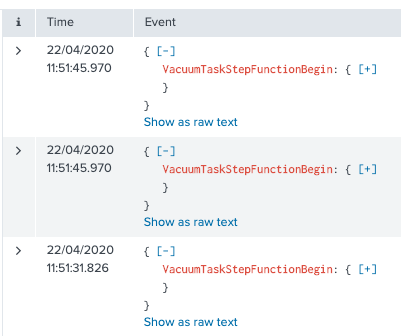
--Multiples Begin events like this
{
   VacuumTaskStepFunctionBegin: {
   NumberOfCustomers: 55
   QueueURL: https://xxxxxxxxxx.fifo
   }
}
--Multiples finish events like this
{
     VacuumTableFinish: {
     DbName: xxxxx
     DbSize: 55 GB
     QueryTimeApproxSeconds: 20
     ServerName: xxxxx
     TableSize: 100 MB
     Query: Select * from xxxxxxx;
   }
}
I am looking for a result like this:
Function                 | Startime                      | Endtime                       | TimeProcessing | ServerCount | DB Count
VacuumTask          | 03-04-2020 08:00 am| 03-05-2020 08:00 am| 24 hours              | 10                   | 55
But also I have more functions like this for other features so my end table would like this:
Function          | Startime                         | Endtime                          | TimeProcessing   | ServerCount.  | DB Count
VacuumTask   | 03-04-2020 08:00 am   | 03-05-2020 08:00 am.  | 24 hours.              | 10                     | 55
Importer         | 03-04-2020 08:00 am   | 03-05-2020 09:00 am    | 1 hour                   |  20                    | 35
Lambda           |03-04-2020 08:00 am    | 03-04-2020 20:00 am   | 12 hours                | 15                     | 20
And so on. All events I have look like the JSON I posted below.
Thank you in advance.
- Mark as New
- Bookmark Message
- Subscribe to Message
- Mute Message
- Subscribe to RSS Feed
- Permalink
- Report Inappropriate Content
Almost there but for some reason the Fields for ServerCount and ServerName are empty
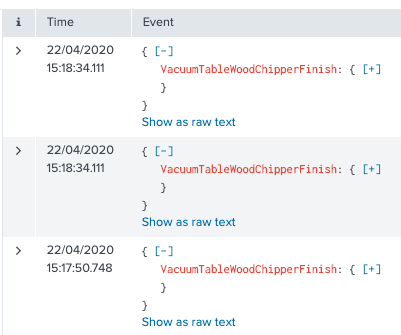
{"VacuumTableWoodChipperFinish": {"DbName": "xxxx@xxx.com", "QueryTimeApproxSeconds": 141, "VacuumQuery": "vacuum analyze entity;", "VacuumCleanupQuery": "Select pg_terminate_backend(24862) from pg_stat_activity where pid = 24862 and query ='vacuum analyze entity;' and datname ='xxxx@xxx.com' and usename='xxxxxxx';->[(True,)]", "VacuumIsCompleteQuery": "Select * from pg_stat_activity where query ='vacuum analyze entity;' and datname ='xxxxx@xxx.com' and usename='xxxxxx' and state='active';->[]", "TableSize": "191 MB", "DbSize": "570 MB", "ServerName": "xxxxxxxxx"}}
- Mark as New
- Bookmark Message
- Subscribe to Message
- Mute Message
- Subscribe to RSS Feed
- Permalink
- Report Inappropriate Content
I don't know your ServerCount and DB Count fields or calculation.
Please fix them.
- Mark as New
- Bookmark Message
- Subscribe to Message
- Mute Message
- Subscribe to RSS Feed
- Permalink
- Report Inappropriate Content
index=yourIndex
| rex "(?ms)(?<Function>[A-Z][a-z]+)"
| rename yourServerCount.field as ServerCount, yourDB Countfield as DBcount
| stats min(_time) as Starttime max(_time) as Endtime range(_time) as TimeProcessing values(ServerCount) as ServerCount values(DBcount) as DBcount by Function
| convert ctime(Starttime) ctime(Endtime)
| eval TimeProcessing=tostring(TimeProcessing,"duration")
- Mark as New
- Bookmark Message
- Subscribe to Message
- Mute Message
- Subscribe to RSS Feed
- Permalink
- Report Inappropriate Content
In your pic, there is only VacuumTaskStepFunctionBegin.
What's Importer and Lambda start and end messages?
- Mark as New
- Bookmark Message
- Subscribe to Message
- Mute Message
- Subscribe to RSS Feed
- Permalink
- Report Inappropriate Content
Sorry, for not be clear.
I have much more Functions, but they all have the same Json template. What changes is just the name of the functions; instead of VacuumTaskStepFunctionBegin I have another one called LambdaTaskStepFunctionBegin and so on...
The idea is to group all transactions in a table and show how long it took to run and the number of servers and databases which the tasks ran.
As the following eg:
{
    LambdaTaskStepFunctionBegin: {
    NumberOfCustomers: 55
    QueueURL: https://xxxxxxxxxx.fifo
    }
 }

{
      LambdaFinish: {
      DbName: xxxxx
      DbSize: 55 GB
      QueryTimeApproxSeconds: 20
      ServerName: xxxxx
      TableSize: 100 MB
      Query: Select * from xxxxxxx;
    }
 }


