Join the Conversation
- Find Answers
- :
- Using Splunk
- :
- Splunk Search
- :
- Re: How to get the total of the events with an err...
- Subscribe to RSS Feed
- Mark Topic as New
- Mark Topic as Read
- Float this Topic for Current User
- Bookmark Topic
- Subscribe to Topic
- Mute Topic
- Printer Friendly Page
- Mark as New
- Bookmark Message
- Subscribe to Message
- Mute Message
- Subscribe to RSS Feed
- Permalink
- Report Inappropriate Content
Hi,
Am quite new to splunk so lease bear with me if I ask obvious questions. However things that were relatively simple in grafana (which we are coming from) seem uge tasks here in splunk. So I do hope someone can help me with the following ...
I have this index, in whch a field, ms_result is extracted. This field can have numerous resultcodes. Only 2 of them are good ("OK" and "200-10000"). All other codes are errorcodes.
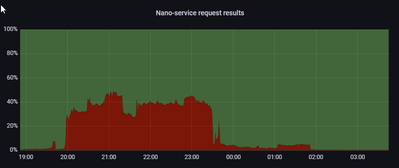
Now I would like the total of the events with an errorcode to appear as a percentage of the overal total of events withing this search (per minute). So let's say, we have 1000 events, and 100 of them have an errorcode, then 10% should ben shown on the (area) graph.
Below the picture I would like to recreate. Is this by any means possible?
Thnx
- Mark as New
- Bookmark Message
- Subscribe to Message
- Mute Message
- Subscribe to RSS Feed
- Permalink
- Report Inappropriate Content
- | fields -
- This is just to remove unnecessary fields that we don't need.
- To order the results you can use the table command at the end of the query:
- | table _time, OK, Error
- The only condition here is _time should be the first value.
Try:
index="aiam_apigw_app_idx" event_type="APIEND"
| eval is_error=if(ms_result=="OK" OR ms_result=="200-10000", "OK", "Error")
| timechart count by is_error
| eval ErrorPerc = (Error/(OK+Error))*100
| eval OKPerc = (OK/(OK+Error))*100
| table _time, OKPerc, ErrorPerc
I hope this helps!!!
- Mark as New
- Bookmark Message
- Subscribe to Message
- Mute Message
- Subscribe to RSS Feed
- Permalink
- Report Inappropriate Content
@ericvdhout - Yeah very much possible to replicate that. I've done it multiple times.🙂
- The first thing you need is a query.
index=<your index> <is there anything else you would like to specify like sourcetype, etc>
| eval is_error=if(ms_result=="OK" OR ms_result=="200-10000", "OK", "Error")
| timechart count by is_error
| eval ErrorPerc = (Error/(OK+Error))*100
| eval OKPerc = (OK/(OK+Enter))*100
| fields - OK, Error- Second chart:
- Select Area chart.
- Go to chart formatting and select stacked chart.
I hope this helps!!!!
- Mark as New
- Bookmark Message
- Subscribe to Message
- Mute Message
- Subscribe to RSS Feed
- Permalink
- Report Inappropriate Content
OK,
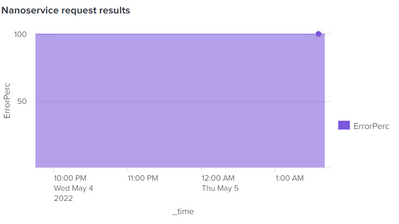
Tried your suggestion, I guess I am doing something wrong.
Looks like this:

This is the actual query:
index="aiam_apigw_app_idx" event_type="APIEND"
| eval is_error=if(ms_result=="OK" OR ms_result=="200-10000", "OK", "Error")
| timechart count by is_error
| eval ErrorPerc = (Error/(OK+Error))*100
| eval OKPerc = (OK/(OK+Enter))*100
| fields - OK, Error
I also chose stacked 100%
- Mark as New
- Bookmark Message
- Subscribe to Message
- Mute Message
- Subscribe to RSS Feed
- Permalink
- Report Inappropriate Content
OK,
| eval OKPerc = (OK/(OK+Enter))*100should be
| eval OKPerc = (OK/(OK+Error))*100
This really looks like something.
Now, I tried to be smart and change
| fields - OK, Errorto
| fields - Error, OKbecause I would like to have the errorlayer at the bottom. But this did not work. Is that possible?
- Mark as New
- Bookmark Message
- Subscribe to Message
- Mute Message
- Subscribe to RSS Feed
- Permalink
- Report Inappropriate Content
- | fields -
- This is just to remove unnecessary fields that we don't need.
- To order the results you can use the table command at the end of the query:
- | table _time, OK, Error
- The only condition here is _time should be the first value.
Try:
index="aiam_apigw_app_idx" event_type="APIEND"
| eval is_error=if(ms_result=="OK" OR ms_result=="200-10000", "OK", "Error")
| timechart count by is_error
| eval ErrorPerc = (Error/(OK+Error))*100
| eval OKPerc = (OK/(OK+Error))*100
| table _time, OKPerc, ErrorPerc
I hope this helps!!!
- Mark as New
- Bookmark Message
- Subscribe to Message
- Mute Message
- Subscribe to RSS Feed
- Permalink
- Report Inappropriate Content
certainly helps.
You do not, by accidnt, happen to know how I can change the colors of the 2 fields?
All over the net I see ways to change it in xml in the source, however I have no xml in the source, merely lookss like json.
- Mark as New
- Bookmark Message
- Subscribe to Message
- Mute Message
- Subscribe to RSS Feed
- Permalink
- Report Inappropriate Content
@ericvdhout - If you have JSON then you are using the new Dashboard Studio framework.
Try the field fieldColors option, something like this format with your chart:
{"OK": "#ff0000","Error": "#cb3b43"}Reference - https://docs.splunk.com/Documentation/Splunk/8.2.6/DashStudio/chartsArea
- Mark as New
- Bookmark Message
- Subscribe to Message
- Mute Message
- Subscribe to RSS Feed
- Permalink
- Report Inappropriate Content
Well, That did not work the way I wanted, but I will ask an extra question for that, for it is kind of offtopic for here.
- Mark as New
- Bookmark Message
- Subscribe to Message
- Mute Message
- Subscribe to RSS Feed
- Permalink
- Report Inappropriate Content
Cool, thank you, Am going to dive into that.
- Mark as New
- Bookmark Message
- Subscribe to Message
- Mute Message
- Subscribe to RSS Feed
- Permalink
- Report Inappropriate Content
The chart starts at the top so the first listed series (field) appears at the top
There are two ways you could "fix" this
| rename OKPerc as " OKPerc"so that the leading space takes precedence
or transpose, sort by name, transpose back
| transpose 0 header_field=_time column_name=percent
| sort - percent
| transpose 0 header_field=percent column_name=_time
- Mark as New
- Bookmark Message
- Subscribe to Message
- Mute Message
- Subscribe to RSS Feed
- Permalink
- Report Inappropriate Content
That wen surprisingly well 🙂
This is almost what I wanted to see. Thnx
(however, I consider the table posiibility Vatsaljagani mentioned a more elegant solution.)
- Mark as New
- Bookmark Message
- Subscribe to Message
- Mute Message
- Subscribe to RSS Feed
- Permalink
- Report Inappropriate Content
True, the table solution works well when you know the field names (which you do in this instance), the transpose and sort method works when the column names are unknown / indeterminant
- Mark as New
- Bookmark Message
- Subscribe to Message
- Mute Message
- Subscribe to RSS Feed
- Permalink
- Report Inappropriate Content
| eval OKPerc = (OK/(OK+Error))*100- Mark as New
- Bookmark Message
- Subscribe to Message
- Mute Message
- Subscribe to RSS Feed
- Permalink
- Report Inappropriate Content
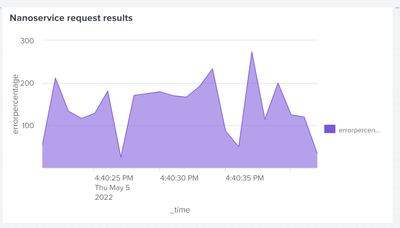
Thnx for the attempt.
However, not yet exactly what I was thinking of?
- Mark as New
- Bookmark Message
- Subscribe to Message
- Mute Message
- Subscribe to RSS Feed
- Permalink
- Report Inappropriate Content
What was the search that produced that chart?
- Mark as New
- Bookmark Message
- Subscribe to Message
- Mute Message
- Subscribe to RSS Feed
- Permalink
- Report Inappropriate Content
index="aiam_apigw_app_idx" event_type="APIEND" |  bin starttime as _time span=1m
| stats count as total count(eval(ms_result=="OK" OR ms_result=="200-10000")) as OK by _time
| eval errorpercentage=round(100*(total-OK)/total,2)
| fields - OK total- Mark as New
- Bookmark Message
- Subscribe to Message
- Mute Message
- Subscribe to RSS Feed
- Permalink
- Report Inappropriate Content
| bin starttime as _time span=1m
| stats count as total count(eval(ms_result=="OK" OR ms_result=="200-10000")) as OK by _time
| eval errorpercentage=round(100*(total-OK)/total,2)
| fields - OK total

