Join the Conversation
- Find Answers
- :
- Using Splunk
- :
- Splunk Search
- :
- Re: Need help to find traffic change from a searc...
- Subscribe to RSS Feed
- Mark Topic as New
- Mark Topic as Read
- Float this Topic for Current User
- Bookmark Topic
- Subscribe to Topic
- Mute Topic
- Printer Friendly Page
- Mark as New
- Bookmark Message
- Subscribe to Message
- Mute Message
- Subscribe to RSS Feed
- Permalink
- Report Inappropriate Content
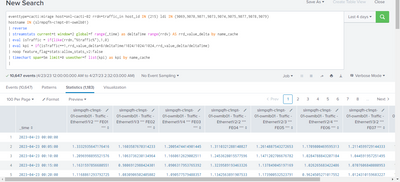
I have a search and resultant output like shown below:
search is --> eventtype=cacti:mirage host=onl-cacti-02 rrdn=traffic_in host_id IN (215) ldi IN (9069,9070,9071,9073,9074,9075,9077,9078,9079)
hostname IN (slrmpqfh-c1mpt-01-owmlb01)
| reverse
| streamstats current=t window=2 global=f range(_time) as deltaTime range(rrdv) AS rrd_value_delta by name_cache
| eval isTraffic = if(like(rrdn,"%traffic%"),1,0)
| eval kpi = if(isTraffic==1,rrd_value_delta*8/deltaTime/1024/1024/1024,rrd_value_delta/deltaTime)
| noop feature_flag=stats:allow_stats_v2:false
| timechart span=5m limit=0 useother=f list(kpi) as kpi by name_cache
What I want to have are new fields fe01, fe02 and so on that would give the percentage change in value for each of the fields. I know timechart is not the command to use here. I tried eventstats and streamstats but wasn't able to do what I wanted.
Each ldi in my search corresponds to a unique name_cache. and host_id corresponds to a unique hostname. It is easy to filter data via ldi and host_id fields than typing long and complicated name_cache and hostname fields.
e.g., the new field FE01 should be like ((1.21-1.33)/1.21-(1.21-1.33))*100 and same formula for other fields.
It means, new fields FE01, FE02 and so on would show the traffic change percent.
@somesoni2 @andrewtrobec @lakshman239 @efavreau @phanTom @diogofgm @woodcock
- Mark as New
- Bookmark Message
- Subscribe to Message
- Mute Message
- Subscribe to RSS Feed
- Permalink
- Report Inappropriate Content
Nevermind, I was able to solve it by myself.
eventtype=cacti:mirage host=onl-cacti-02 rrdn=traffic_in host_id IN (215) ldi IN (9069,9070,9071,9073,9074,9075,9077,9078,9079)
hostname IN (slrmpqfh-c1mpt-01-owmlb01)
| reverse
| streamstats current=t window=2 global=f range(_time) as deltaTime range(rrdv) AS rrd_value_delta by name_cache
| eval isTraffic = if(like(rrdn,"%traffic%"),1,0)
| eval kpi = if(isTraffic==1,rrd_value_delta*8/deltaTime/1024/1024/1024,rrd_value_delta/deltaTime)
| streamstats current=f window=2 global=f last(kpi) as previouskpi by name_cache
| eval change=round(((kpi-previouskpi)/previouskpi)*100,2)
| noop feature_flag=stats:allow_stats_v2:false
| timechart span=5m limit=0 useother=f first(change) as change_percent list(kpi) as kpi by name_cache

