Join the Conversation
- Find Answers
- :
- Using Splunk
- :
- Splunk Search
- :
- How to create multiple line charts in splunk?
- Subscribe to RSS Feed
- Mark Topic as New
- Mark Topic as Read
- Float this Topic for Current User
- Bookmark Topic
- Subscribe to Topic
- Mute Topic
- Printer Friendly Page
- Mark as New
- Bookmark Message
- Subscribe to Message
- Mute Message
- Subscribe to RSS Feed
- Permalink
- Report Inappropriate Content
Hi
I have the following data in a dictionary and I would like to create a multi-series line chart with timestamp X-axis and count on Y-axis and a line chart for each of the keys in the dictionary,I can't seem to figure out how to do this in splunk?
1.Am I logging in the data in the right formart in splunk?Do I need to change it?
2.what sort of splunk query should I use to generate this line chart?
entry = {
    "Analyze.Count":"700",
    "Analyze.Screen":"700",
    "Analyze.Investiage":"701",
    "Analyze.Review":"703",
    "timestamp": int(time.time())  # Can also use datetime.datetime.now().isoformat()
}
requests.post(url="https://endpoint?uat=1&sourcetype=radar_statistics_data2", json=entry)
EXPECTED OUTPUT:-

- Mark as New
- Bookmark Message
- Subscribe to Message
- Mute Message
- Subscribe to RSS Feed
- Permalink
- Report Inappropriate Content
I was able to solve this using following query
index=<indexname> sourcetype=<sourcetype>| chart values(Analyze.Investiaget) as Investigate values(Analyze.Review) as Review values(Analyze.Screent) as Screen over _time
- Mark as New
- Bookmark Message
- Subscribe to Message
- Mute Message
- Subscribe to RSS Feed
- Permalink
- Report Inappropriate Content
@isplunk2999 If your problem is resolved, please accept an answer to help future readers.
If this reply helps you, Karma would be appreciated.
- Mark as New
- Bookmark Message
- Subscribe to Message
- Mute Message
- Subscribe to RSS Feed
- Permalink
- Report Inappropriate Content
@richgalloway - accepted 🙂
- Mark as New
- Bookmark Message
- Subscribe to Message
- Mute Message
- Subscribe to RSS Feed
- Permalink
- Report Inappropriate Content
@richgalloway - accepeted 🙂
- Mark as New
- Bookmark Message
- Subscribe to Message
- Mute Message
- Subscribe to RSS Feed
- Permalink
- Report Inappropriate Content
Hi isplunk2999,
based on your examples you can do it like this :
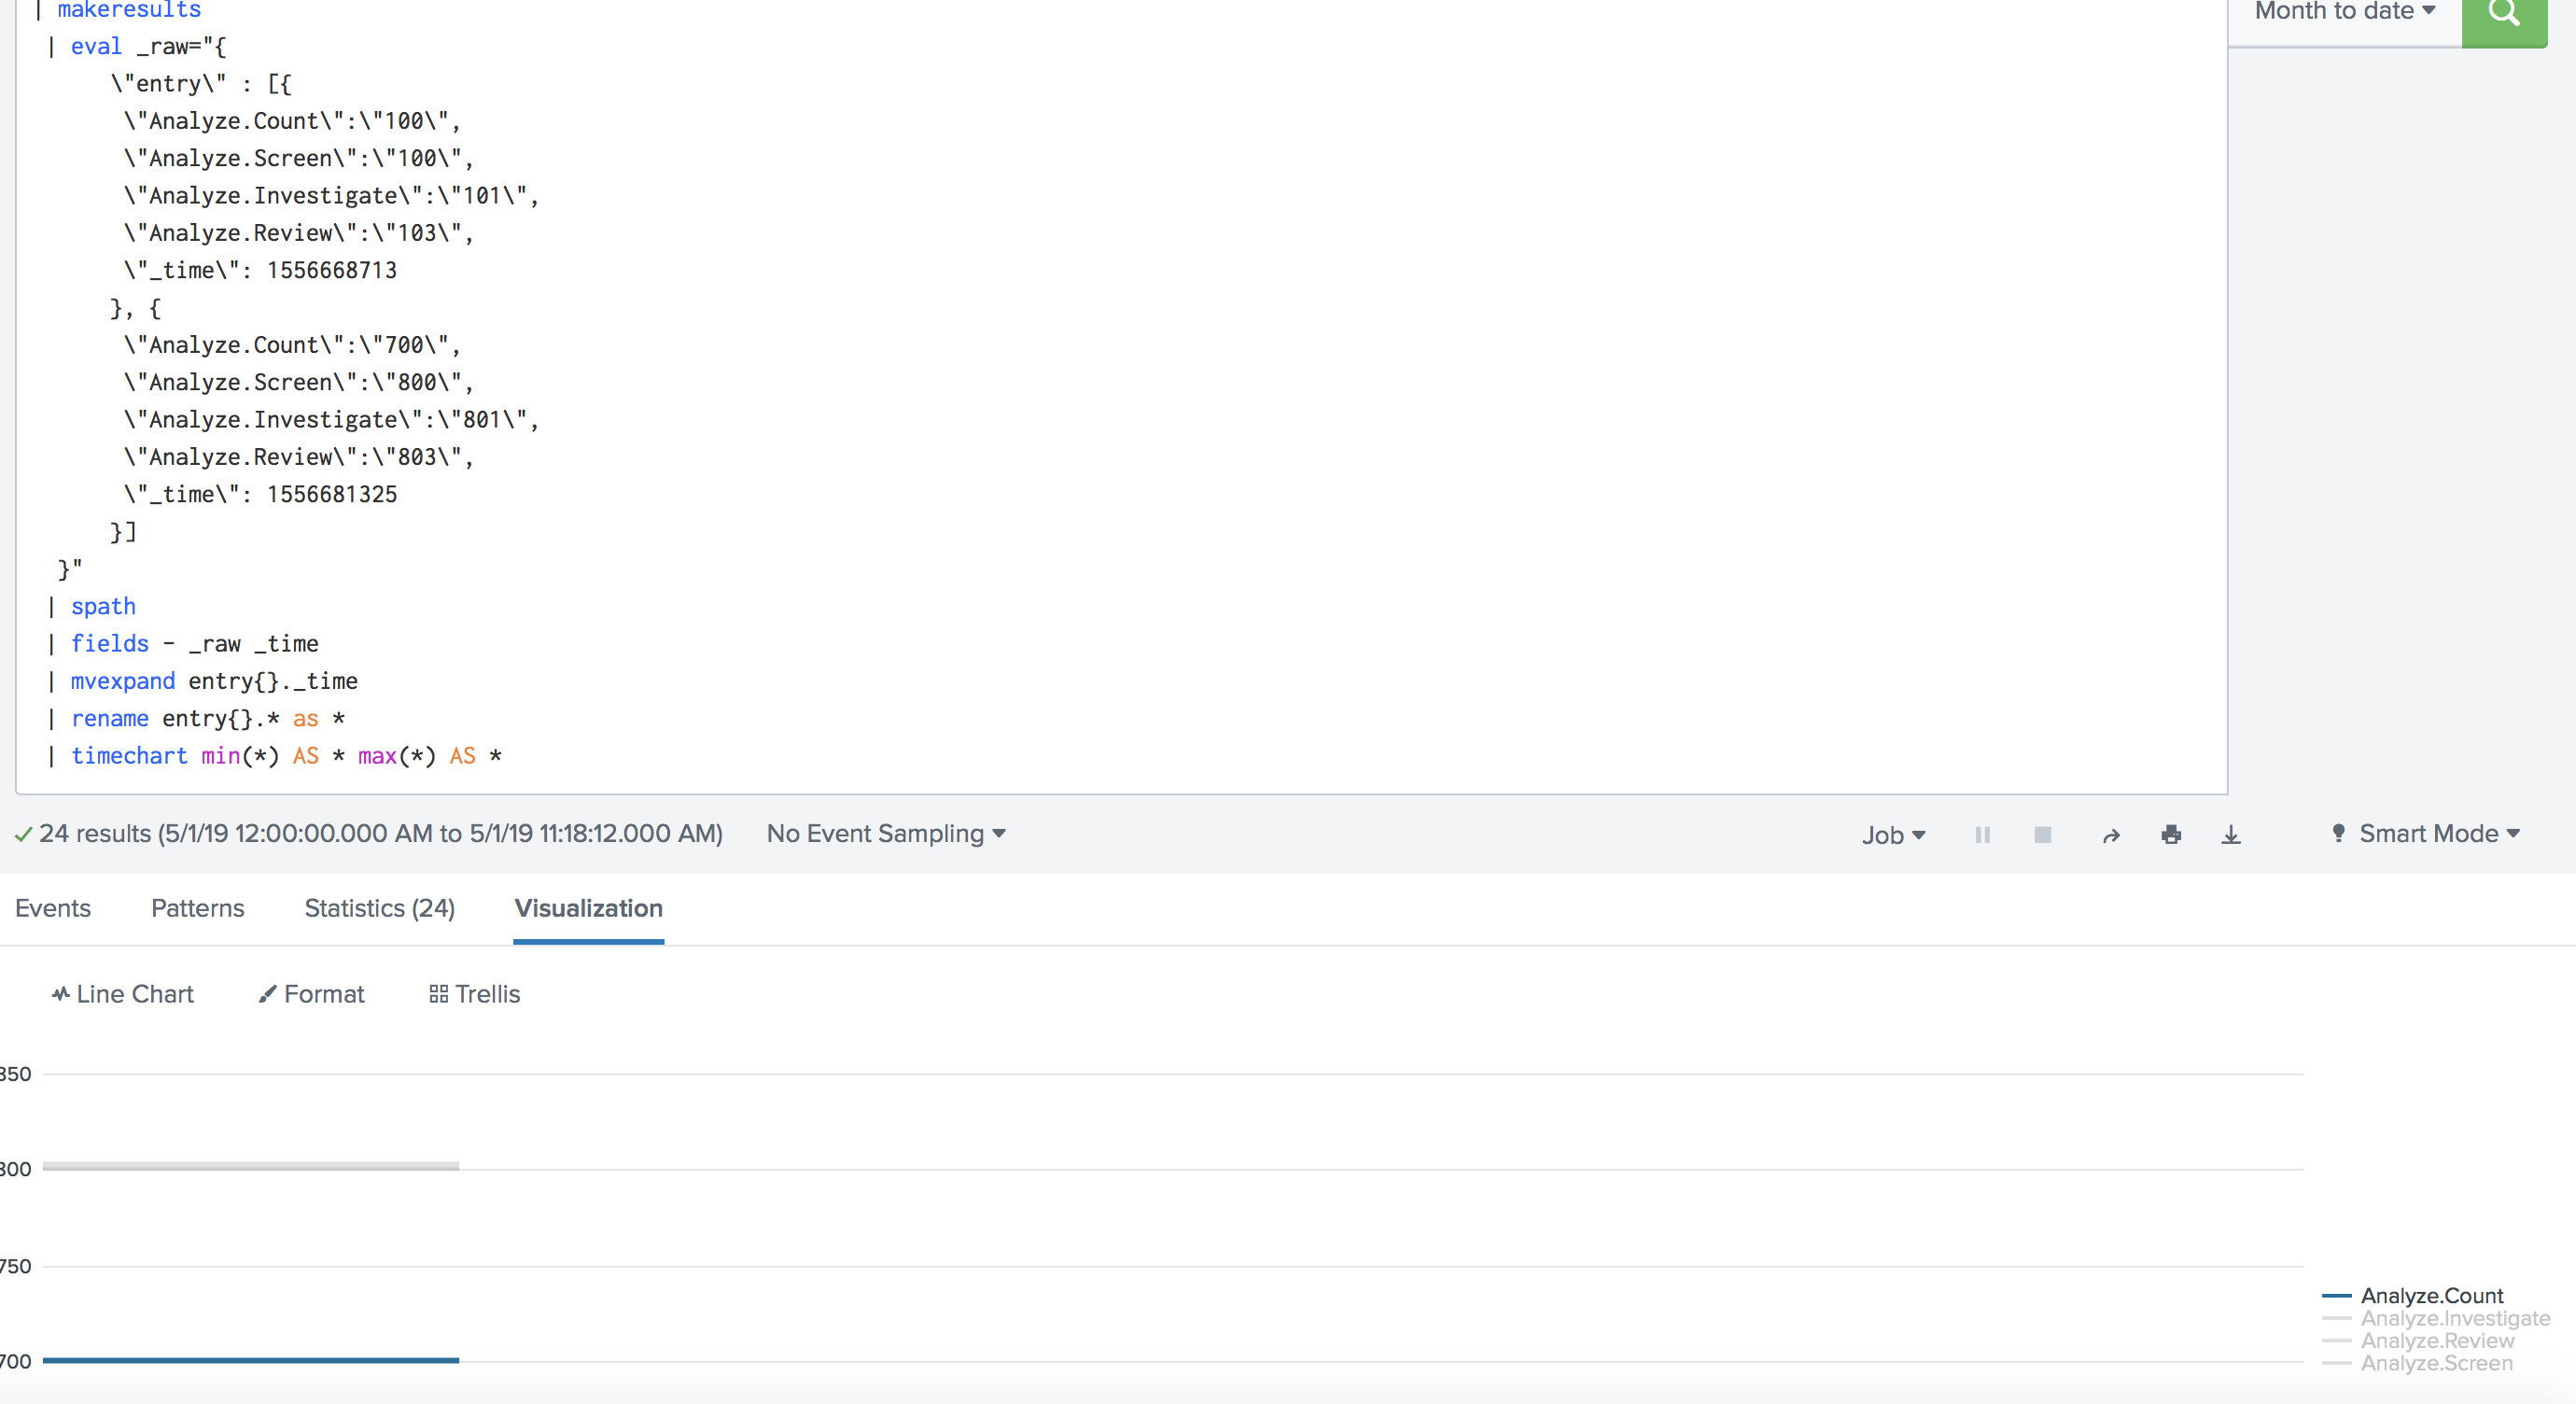
| makeresults
| eval _raw="{
     \"entry\" : [{
      \"Analyze.Count\":\"700\",
      \"Analyze.Screen\":\"700\",
      \"Analyze.Investiage\":\"701\",
      \"Analyze.Review\":\"703\",
      \"_time\": 1556681125
     }, {
      \"Analyze.Count\":\"800\",
      \"Analyze.Screen\":\"800\",
      \"Analyze.Investiage\":\"801\",
      \"Analyze.Review\":\"803\",
      \"_time\": 1556681325
     }]
 }"
| spath
| fields - _raw _time
| mvexpand entry{}._time
| rename entry{}.* as *
| timechart min(*) AS * max(*) AS *
Everything up until the rename is used to create dummy data and the time chart shows it as a chart.
The important thing for you is to get the data correct on boarded into Splunk as JSON (Hint: props.conf using the KV_MODE = json option for that sourcetype on your search head), make sure the _time is picked up from the JSON field timestamp (Hint: again props.conf but this time on the parsing Splunk instance https://docs.splunk.com/Documentation/Splunk/latest/Data/Configuretimestamprecognition ) and then use a timechart on the fields entry{}.Analyze*.
Hope this helps ...
cheers, MuS
- Mark as New
- Bookmark Message
- Subscribe to Message
- Mute Message
- Subscribe to RSS Feed
- Permalink
- Report Inappropriate Content
Hi MuS:
Few questions
1.How to make sure the _time is picked up from the JSON field
timestamp?should I change the
timestamp name to _time ?please
advise
2. Code I posted is in python,as you can see its already in JSON,you
stated"The important thing for you is
to get the data correct on boarded
into Splunk as JSON" , are you
suggesting to do it any different?
3.I tried as below query as you mentioned everything until rename is
to create dummy data but it didn't
work probably because of #1 above,
please see link
https://imagizer.imageshack.com/img924/663/1Qt9LU.png
once we fix #1 is the below query the right one?
"index=indexname sourcetype=radar_statistics_data3 | timechart min(*) AS * max(*) AS *"
COMMENT UPDATE:
1. It sounds like our company splunk instance assigns timestamp values automatically by using information that it finds in the raw event data
2. I think it is already in JSON format
3.so what is missing in my query?
ANOTHER UPDATE:
I downloaded a local splunk instance and tried your code ,the line graph just shows only the latest element in the list,look at https://imagizer.imageshack.com/img923/1484/EksD5B.png and https://imagizer.imageshack.com/img921/7475/mdvETI.png
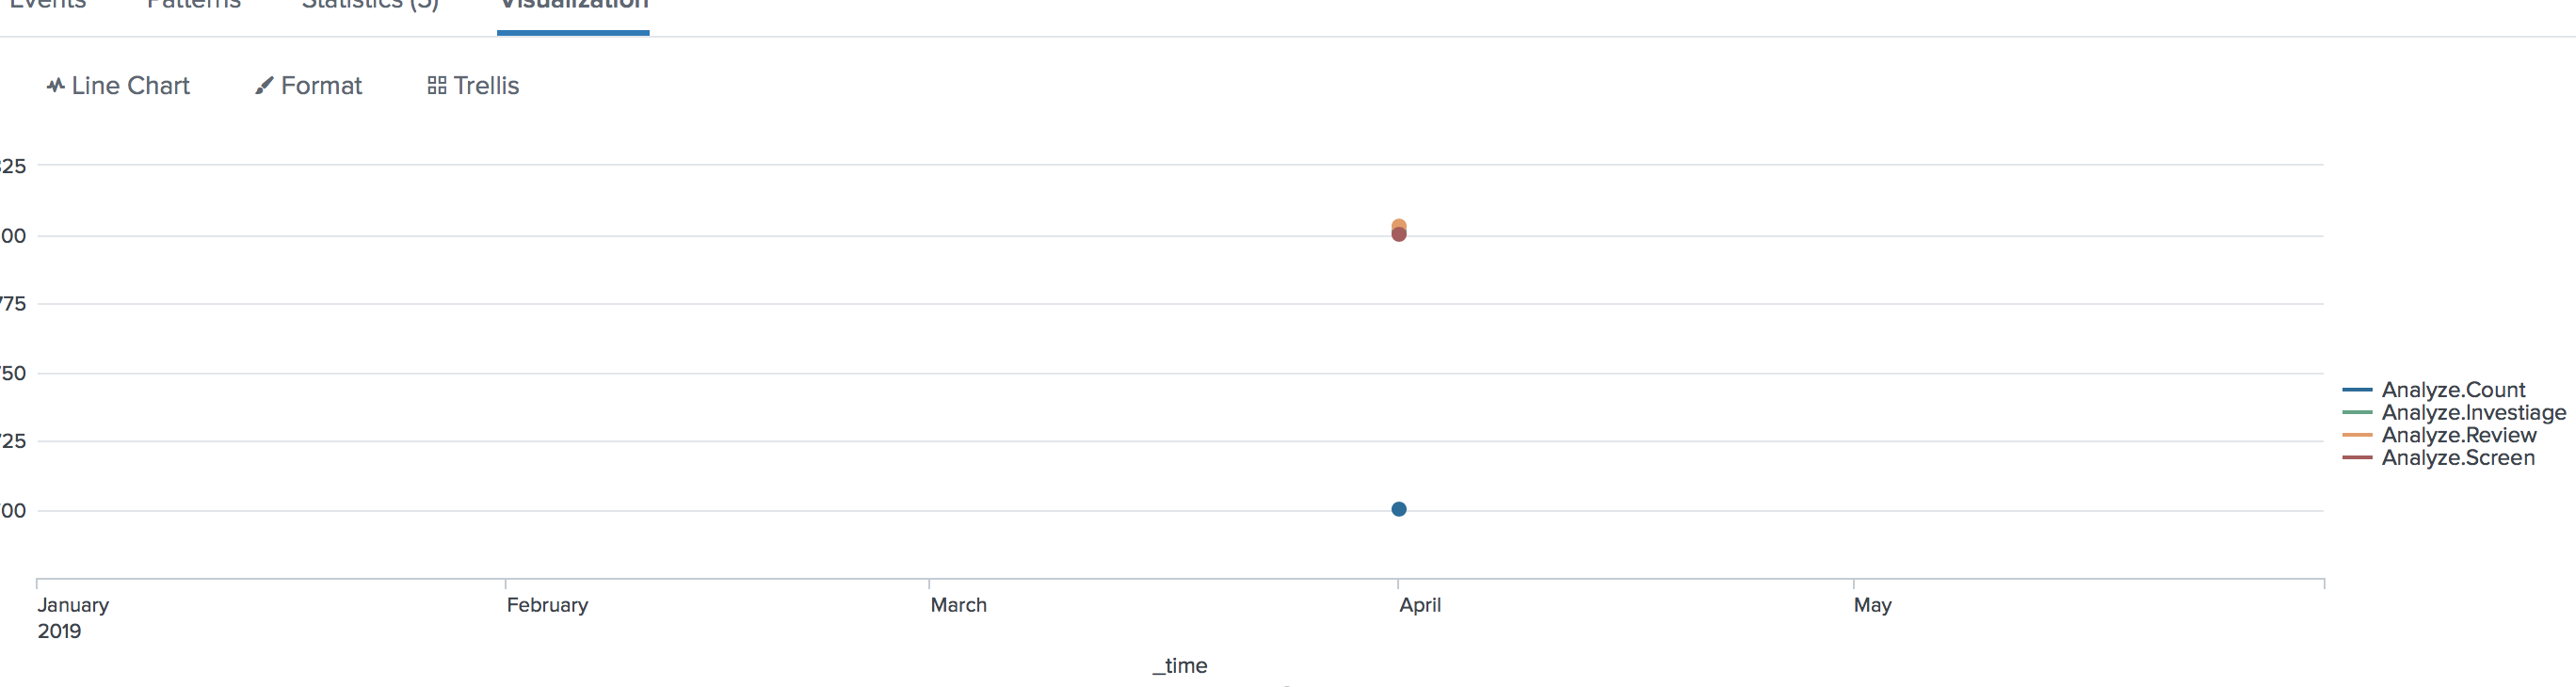
any idea what is wrong?
Data Management Digest – December 2025
Index This | What is broken 80% of the time by February?
Unlock Faster Time-to-Value on Edge and Ingest Processor with New SPL2 Pipeline ...
