Are you a member of the Splunk Community?
- Find Answers
- :
- Using Splunk
- :
- Splunk Search
- :
- Re: How to create a timechart on license usage to ...
- Subscribe to RSS Feed
- Mark Topic as New
- Mark Topic as Read
- Float this Topic for Current User
- Bookmark Topic
- Subscribe to Topic
- Mute Topic
- Printer Friendly Page
- Mark as New
- Bookmark Message
- Subscribe to Message
- Mute Message
- Subscribe to RSS Feed
- Permalink
- Report Inappropriate Content
How to create a timechart on license usage to show the max usage and the individual usage for each of our Splunk environments?
I have been trying to create a timechart on license usage. I did try this search below..
index=_internal source=*license_usage.log* type=Usage NOT idx=sos| timechart span=1d sum(eval(round(b/1024/1024/1024,5))) by idx |eval Test=(uat1+uat2+uat3) | rename main As Prod | eval TotalLicenseConsumption=(Test+Prod) | fields - default uat1 uat2 uat3
Looking for a chart with below requirement. Any help would be appreciated.
1.to display the max license(200GB in my case) in the bar graph
2.show the individual usage line graph (might be a overlay graph on top of 1) for Test, Prod and Total license consumption.
- Mark as New
- Bookmark Message
- Subscribe to Message
- Mute Message
- Subscribe to RSS Feed
- Permalink
- Report Inappropriate Content
For the overall license usage and total available, explore the REST API. I used that as the basis for a fill-gauge panel using the below search. The "Danger Zone(tm)" adjusts based on time of day.
| rest splunk_server=local /services/licenser/pools/your_pool |
fields title effective_quota used_bytes |
eval used=round(used_bytes/(1024*1024*1024),2) |
eval h=tonumber(strftime(now(),"%H"))/24 |
eval danger=round(h*effective_quota/(1024*1024*1024),0) |
eval max=round(effective_quota/(1024*1024*1024),0) |
eval base=0 |
eval gauge_top=max+(max*.01) |
gauge used base danger max gauge_top
- Mark as New
- Bookmark Message
- Subscribe to Message
- Mute Message
- Subscribe to RSS Feed
- Permalink
- Report Inappropriate Content
- Mark as New
- Bookmark Message
- Subscribe to Message
- Mute Message
- Subscribe to RSS Feed
- Permalink
- Report Inappropriate Content
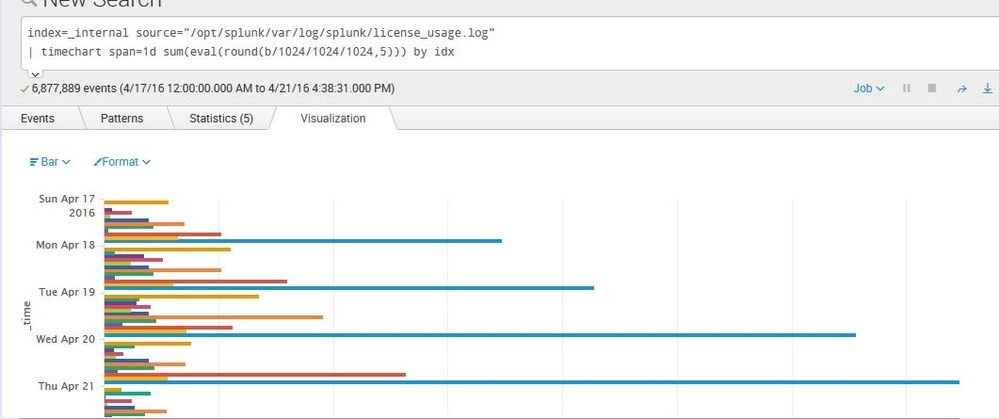
I just ran a simplified one on one indexer -
index=_internal source="/opt/splunk/var/log/splunk/license_usage.log"
| timechart span=1d sum(eval(round(b/1024/1024/1024,5))) by idx
The report shows mostly NULL - what can it be?
Sorry, the picture is below...
- Mark as New
- Bookmark Message
- Subscribe to Message
- Mute Message
- Subscribe to RSS Feed
- Permalink
- Report Inappropriate Content
based on the picture you attached it has to show the license usage by individual indexes. run the search for more than a day as the search says span=1d
- Mark as New
- Bookmark Message
- Subscribe to Message
- Mute Message
- Subscribe to RSS Feed
- Permalink
- Report Inappropriate Content
Changed it to span=1w and still I see the NULLs...
- Mark as New
- Bookmark Message
- Subscribe to Message
- Mute Message
- Subscribe to RSS Feed
- Permalink
- Report Inappropriate Content
can you just try and check the fields if you can find idx as we did a timechart by idx.
index=_internal source="/opt/splunk/var/log/splunk/license_usage.log"
- Mark as New
- Bookmark Message
- Subscribe to Message
- Mute Message
- Subscribe to RSS Feed
- Permalink
- Report Inappropriate Content
I get the feeling you may be on an older version of Splunk? If so, upgrade to 6.4.0 and take a look at Settings -> Licensing -> 30 day report on your license master.
That has maximum pool size overlays, split by pool, etc.
- Mark as New
- Bookmark Message
- Subscribe to Message
- Mute Message
- Subscribe to RSS Feed
- Permalink
- Report Inappropriate Content
Splunk 6.3 will do fine. I was just thrown by idx=sos, Splunk on Splunk has been superseded by the distributed management console.
To get the query, open Settings -> Licensing -> 30 Days and click the magnifying glass in the bottom left of the chart.
- Mark as New
- Bookmark Message
- Subscribe to Message
- Mute Message
- Subscribe to RSS Feed
- Permalink
- Report Inappropriate Content
Martin,
We're on 6.3.1, and we don't have a plan to upgrade to 6.4 shortly. Is there any way i can get a query which report maximum pool size overlays in the chart..?

