Join the Conversation
- Find Answers
- :
- Using Splunk
- :
- Splunk Search
- :
- How to create a time chart of HTTP error codes as ...
- Subscribe to RSS Feed
- Mark Topic as New
- Mark Topic as Read
- Float this Topic for Current User
- Bookmark Topic
- Subscribe to Topic
- Mute Topic
- Printer Friendly Page
- Mark as New
- Bookmark Message
- Subscribe to Message
- Mute Message
- Subscribe to RSS Feed
- Permalink
- Report Inappropriate Content
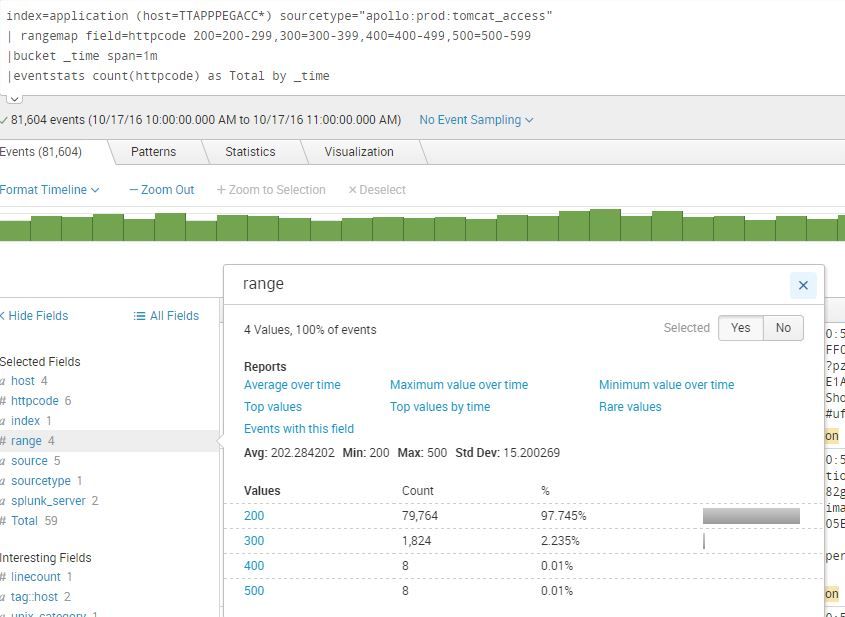
I am trying to display the percentage of a rangemap as related to the total events while excluding the httpcode=200 from the chart.
I don't have to use a rangemap, but it would help to make the chart a little cleaner. Basically, I want to do this, without the 200's, in a timechart.
So far, what I have is this.
index=application (host=TTAPPPEGACC*) sourcetype="apollo:prod:tomcat_access"
| rangemap field=httpcode 200=200-299,300=300-399,400=400-499,500=500-599
|bucket _time span=1m
|eventstats count(httpcode) as Total by _time
- Mark as New
- Bookmark Message
- Subscribe to Message
- Mute Message
- Subscribe to RSS Feed
- Permalink
- Report Inappropriate Content
Sundareshr put me on the right track, and I am interested on playing with foreach a little more.
Here is what I ended up with. This is for a dashboard with time exclusion logic for maintance windows, which is why there is a eval hours and |where (NOT hours=.
index=application (host=TTAPPPEGACC*) sourcetype="apollo:prod:tomcat_access"
|eval hours=strftime(_time, "%H")
|where (NOT hours=25 AND NOT hours=12 AND NOT hours=1 AND NOT hours=2)
|rangemap field=httpcode http_200=200-299,http_300=300-399,http_400=400-499,http_500=500-599
|bucket _time span=1h
|chart count over _time by range
|addtotals
|timechart span=1h values(eval(http_400*100/Total)) AS 400s, values(eval(http_500*100/Total)) AS 500s
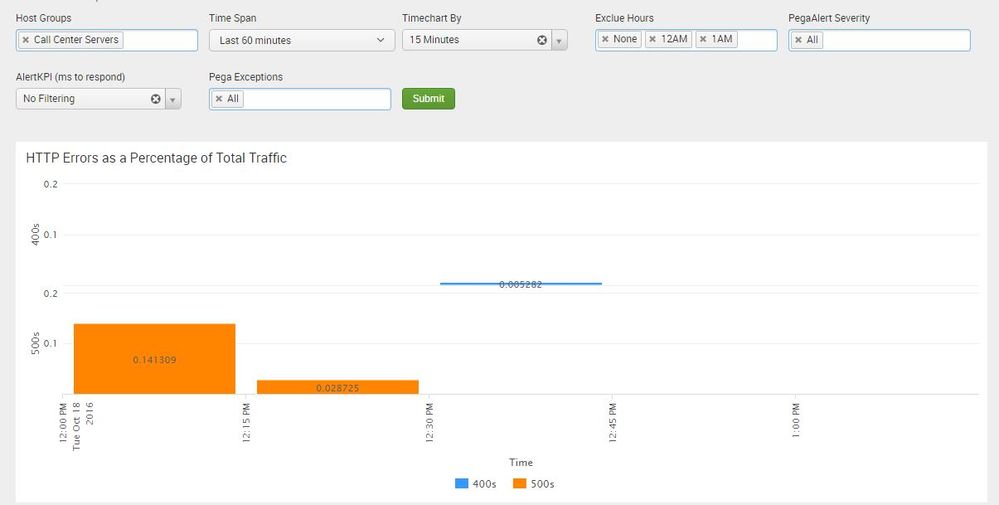
Which, if anyone is curious looks like this.
- Mark as New
- Bookmark Message
- Subscribe to Message
- Mute Message
- Subscribe to RSS Feed
- Permalink
- Report Inappropriate Content
Try this
index=application (host=TTAPPPEGACC*) sourcetype="apollo:prod:tomcat_access"
 | rangemap field=httpcode 200=200-299,300=300-399,400=400-499,500=500-599
 |bucket _time span=1m
 | chart count over _time by range
 | addtotals
 | foreach *00 [ eval perc_<<MATCHSTR>>00=ROUND((<<FIELD>>/Total)*100), 0) ]
 | table _time perc*
- Mark as New
- Bookmark Message
- Subscribe to Message
- Mute Message
- Subscribe to RSS Feed
- Permalink
- Report Inappropriate Content
Thanks for the response Sundareshr,
The foreach, eval logic is failing, maybe it cannot identify the field *00 since it is generated by rangemap and does not show as standalone fields, but as values of a field named "range".
"Error in 'eval' command: Failed to parse the provided arguments. Usage: eval dest_key = expression"
I'd like to get it working, since I have never used foreach before, and would like to use it to shorten some of my longer searches with repeating eval logic.
I've used something similar in the past to generate percentages, that involved inserting a stats command, and then multiple eval's to generate the percentages. It was basicly lifted from this Answer here.
https://answers.splunk.com/answers/301823/how-to-search-the-percentage-and-count-of-total-by.html
- Mark as New
- Bookmark Message
- Subscribe to Message
- Mute Message
- Subscribe to RSS Feed
- Permalink
- Report Inappropriate Content
So this brings back results, I yanked out the round logic. But the numbers are very wrong.
index=application (host=TTAPPPEGACC*) sourcetype="apollo:prod:tomcat_access" httpcode=*
| rangemap field=httpcode 200=200-299,300=300-399,400=400-499,500=500-599
|bucket _time span=1m
| chart count over _time by range
| addtotals
| foreach *00 [ eval perc_<<MATCHSTR>>00=(<<FIELD>>/Total)*100 ]
We see here that 500 for the range is 0, but the percentage shows as 39%
200 300 400 500 perc_200 perc_300 perc_400 perc_500 Total
1009 14 0 0 19.550342 29.325513 39.100684 48.875855 1023
- Mark as New
- Bookmark Message
- Subscribe to Message
- Mute Message
- Subscribe to RSS Feed
- Permalink
- Report Inappropriate Content
I figured out what was wrong with the numbers. Because the range names were numbers themselves, splunk was taking the range name as a string.
So... Total / 200 * 100 =
Which in the case of the previous example is
1023 / 200 * 100 = 19.55....
- Mark as New
- Bookmark Message
- Subscribe to Message
- Mute Message
- Subscribe to RSS Feed
- Permalink
- Report Inappropriate Content
For fieldnames that are numbers, you can enclose them in single-quotes '200'. So, in your foreach, you would do like this '<<FIELD>>'


