Turn on suggestions
Auto-suggest helps you quickly narrow down your search results by suggesting possible matches as you type.
Splunk Search
×
Are you a member of the Splunk Community?
Sign in or Register with your Splunk account to get your questions answered, access valuable resources and connect with experts!
Turn on suggestions
Auto-suggest helps you quickly narrow down your search results by suggesting possible matches as you type.
- Find Answers
- :
- Using Splunk
- :
- Splunk Search
- :
- How to create a stacked bar graph showing total ti...
Options
- Subscribe to RSS Feed
- Mark Topic as New
- Mark Topic as Read
- Float this Topic for Current User
- Bookmark Topic
- Subscribe to Topic
- Mute Topic
- Printer Friendly Page
- Mark as New
- Bookmark Message
- Subscribe to Message
- Mute Message
- Subscribe to RSS Feed
- Permalink
- Report Inappropriate Content
timgirgis
Explorer
02-17-2016
07:38 AM
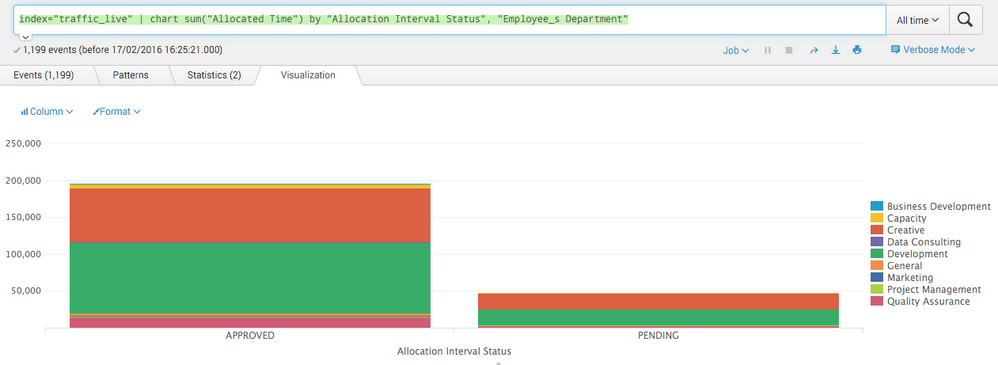
I want to create a stacked bar graph showing 2 columns stacked by department: 1 column is the total time and the second column is the total time-(time where status = pending)
REQUIRED = "Allocated Time" where "Allocation Interval Status" = APPROVED OR PENDING
CURRENT="Allocated Time" where "Allocation Interval Status" = APPROVED
These 2 columns should show as a stacked bar graph where the stacking is done by "Employee_s Department"
1 Solution
- Mark as New
- Bookmark Message
- Subscribe to Message
- Mute Message
- Subscribe to RSS Feed
- Permalink
- Report Inappropriate Content
somesoni2
Revered Legend
02-17-2016
03:52 PM
Try something like this
index=traffic_live | chart sum("Allocated Time") over "Employee_s Department" by "Allocation Interval Status" | eval REQUIRED=APPROVED+PENDING | rename APPROVED as CURRENT | table "Employee_s Department" REQUIRED CURRENT
- Mark as New
- Bookmark Message
- Subscribe to Message
- Mute Message
- Subscribe to RSS Feed
- Permalink
- Report Inappropriate Content
timgirgis
Explorer
02-18-2016
07:09 AM
Thanks so much for your help, we took it from there and came up with this, which gave us what we wanted:
source="TrafficLiveAll.csv" | chart sum("Allocated Time") over "Employee_s Department" by "Allocation Interval Status" | eval REQUIRED=(APPROVED+PENDING)/480 | eval CURRENT=APPROVED/480 | table REQUIRED CURRENT | transpose | rename "row 1" as "Business Development", "row 2" as "Capacity", "row 3" as "Creative", "row 4" as "Data Consulting", "row 5" as "Development", "row 6" as "General", "row 7" as "Marketing", "row 8" as "Project Management", "row 9" as "Quality Assurance"
Get Updates on the Splunk Community!
Splunk Observability for AI
Don’t miss out on an exciting Tech Talk on Splunk Observability for AI!Discover how Splunk’s agentic AI ...
Splunk Enterprise Security 8.x: The Essential Upgrade for Threat Detection, ...
Watch On Demand the Tech Talk on November 6 at 11AM PT, and empower your SOC to reach new heights!
Duration: ...
Splunk Observability as Code: From Zero to Dashboard
For the details on what Self-Service Observability and Observability as Code is, we have some awesome content ...

