Turn on suggestions
Auto-suggest helps you quickly narrow down your search results by suggesting possible matches as you type.
Splunk Search
×
Are you a member of the Splunk Community?
Sign in or Register with your Splunk account to get your questions answered, access valuable resources and connect with experts!
Turn on suggestions
Auto-suggest helps you quickly narrow down your search results by suggesting possible matches as you type.
- Find Answers
- :
- Using Splunk
- :
- Splunk Search
- :
- Re: How to chart and compare memory usage of my JS...
Options
- Subscribe to RSS Feed
- Mark Topic as New
- Mark Topic as Read
- Float this Topic for Current User
- Bookmark Topic
- Subscribe to Topic
- Mute Topic
- Printer Friendly Page
- Mark as New
- Bookmark Message
- Subscribe to Message
- Mute Message
- Subscribe to RSS Feed
- Permalink
- Report Inappropriate Content
suarezry
Builder
01-26-2017
11:40 AM
I've got an interesting JSON:
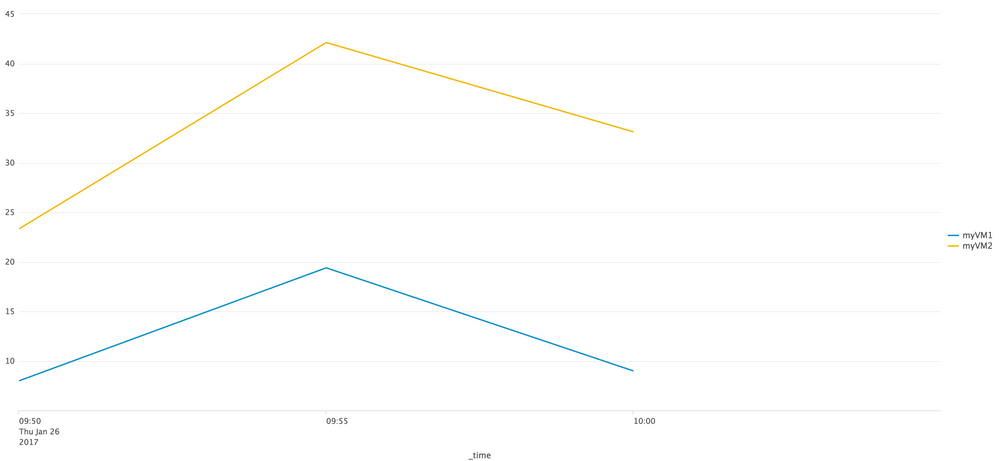
{"timeStamp":"2017-01-26 23:59","name":"myVM1","counter":"mem.usage.average","description":"Memory usage as percentage of total configured or available memory","unit":"%","values":{"2017-01-26 10:00":"8.99","2017-01-26 09:55":"19.39","2017-01-26 09:50":"7.99"}}
{"timeStamp":"2017-01-26 23:59","name":"myVM2","counter":"mem.usage.average","description":"Memory usage as percentage of total configured or available memory","unit":"%","values":{"2017-01-26 10:00":"33.11","2017-01-26 09:55":"42.12","2017-01-26 09:50":"23.32"}}
The key is the timestamps. Can someone please provide the syntax to chart the two so I can compare memory usage? Thanks!
1 Solution
- Mark as New
- Bookmark Message
- Subscribe to Message
- Mute Message
- Subscribe to RSS Feed
- Permalink
- Report Inappropriate Content
somesoni2
Revered Legend
01-26-2017
12:08 PM
Assuming fields are all extracted, try like this
your base search | table name values* | untable name timestamp value | eval _time=strptime(timestamp,"values.%Y-%m-%d %H:%M") | timechart avg(value) by name
- Mark as New
- Bookmark Message
- Subscribe to Message
- Mute Message
- Subscribe to RSS Feed
- Permalink
- Report Inappropriate Content
suarezry
Builder
01-26-2017
01:54 PM
thank you! Exactly what I needed!
- Mark as New
- Bookmark Message
- Subscribe to Message
- Mute Message
- Subscribe to RSS Feed
- Permalink
- Report Inappropriate Content
javiergn
Super Champion
01-26-2017
12:04 PM
I've tried to replicate your question in my lab and I came up with the following. Let me know if it helps:
| makeresults
| fields - _time
| eval raw = "
    {\"timeStamp\":\"2017-01-26 23:59\",\"name\":\"myVM1\",\"counter\":\"mem.usage.average\",\"description\":\"Memory usage as percentage of total configured or available memory\",\"unit\":\"%\",\"values\":{\"2017-01-26 10:00\":\"8.99\",\"2017-01-26 09:55\":\"19.39\",\"2017-01-26 09:50\":\"7.99\"}}
    ;
    {\"timeStamp\":\"2017-01-26 23:59\",\"name\":\"myVM2\",\"counter\":\"mem.usage.average\",\"description\":\"Memory usage as percentage of total configured or available memory\",\"unit\":\"%\",\"values\":{\"2017-01-26 10:00\":\"33.11\",\"2017-01-26 09:55\":\"42.12\",\"2017-01-26 09:50\":\"23.32\"}}
"
| eval raw = split(raw, ";")
| mvexpand raw
| spath input=raw path=name output=name
| spath input=raw path=values output=timevalues
| rex field=timevalues max_match=0 "(?<pairs>\"\d{4}\-\d{2}\-\d{2} \d{2}\:\d{2}\"\:\"[\d\.]+\")"
| mvexpand pairs
| rex field=pairs "\"(?<time>\d{4}\-\d{2}\-\d{2} \d{2}\:\d{2})\"\:\"(?<value>[\d\.]+)\""
| eval _time = strptime(time, "%Y-%m-%d %H:%M")
| timechart span=5m first(value) as value by name
Output: see pictures below
- Mark as New
- Bookmark Message
- Subscribe to Message
- Mute Message
- Subscribe to RSS Feed
- Permalink
- Report Inappropriate Content
suarezry
Builder
01-26-2017
11:42 AM
Sorry, forgot to add that Splunk is already correctly parsing these events as JSON
- Mark as New
- Bookmark Message
- Subscribe to Message
- Mute Message
- Subscribe to RSS Feed
- Permalink
- Report Inappropriate Content
somesoni2
Revered Legend
01-26-2017
11:48 AM
Compare usage of both VMs at a give instance? The values contains multiple recording of memory usage, so you want to plot all of 3?
- Mark as New
- Bookmark Message
- Subscribe to Message
- Mute Message
- Subscribe to RSS Feed
- Permalink
- Report Inappropriate Content
suarezry
Builder
01-26-2017
11:51 AM
yes please, all three in a chart
Get Updates on the Splunk Community!
Fall Into Learning with New Splunk Education Courses
Every month, Splunk Education releases new courses to help you branch out, strengthen your data science roots, ...
Super Optimize your Splunk Stats Searches: Unlocking the Power of tstats, TERM, and ...
By Martin Hettervik, Senior Consultant and Team Leader at Accelerate at Iver, Splunk MVPThe stats command is ...
How Splunk Observability Cloud Prevented a Major Payment Crisis in Minutes
Your bank's payment processing system is humming along during a busy afternoon, handling millions in hourly ...


