- Find Answers
- :
- Using Splunk
- :
- Splunk Search
- :
- How to calculate time difference when the zone cha...
- Subscribe to RSS Feed
- Mark Topic as New
- Mark Topic as Read
- Float this Topic for Current User
- Bookmark Topic
- Subscribe to Topic
- Mute Topic
- Printer Friendly Page
- Mark as New
- Bookmark Message
- Subscribe to Message
- Mute Message
- Subscribe to RSS Feed
- Permalink
- Report Inappropriate Content
How to calculate time difference when the zone changes from one zone to another zone based on last "off " value?
- Mark as New
- Bookmark Message
- Subscribe to Message
- Mute Message
- Subscribe to RSS Feed
- Permalink
- Report Inappropriate Content
| eval time_off=if(message=="off",_time,null())
| filldown time_off
| eval diff=if(def=="Changed",_time-time_off,null())- Mark as New
- Bookmark Message
- Subscribe to Message
- Mute Message
- Subscribe to RSS Feed
- Permalink
- Report Inappropriate Content
- Mark as New
- Bookmark Message
- Subscribe to Message
- Mute Message
- Subscribe to RSS Feed
- Permalink
- Report Inappropriate Content
You haven't provided sufficient information in your screen grabs to be able to determine why you are getting those results.
Having said that, the assumption made by the search is that all the events are in ascending _time order (which they appear to be in your graphic). If this is not the case, please provide a more accurate description of your usecase.
- Mark as New
- Bookmark Message
- Subscribe to Message
- Mute Message
- Subscribe to RSS Feed
- Permalink
- Report Inappropriate Content
|rex field=_raw "(?<message>OFF.*)|((?<sensor>Battery).*?(?<zone>\w+_ZONE))"
|eval Device_ID=mvindex(split(source,"/"),5)
|table Device_ID _time message sensor zone
|where isnotnull(sensor) OR isnotnull(zone) OR isnotnull(message)
|sort 0 Device_ID _time
|streamstats current=f last(_time) as last_time1 last(zone) as last_zone by Device_ID
|eval timestamp=strftime(last_time1,"%Y-%m-%d %H:%M:%S")
|eval def=case(zone="INTERVENTION_ZONE" AND last_zone="SAFE_ZONE","Changed",zone="SAFE_ZONE" AND last_zone="INTERVENTION_ZONE","Changed",zone="LOWER_THRESHOLD_ZONE" AND last_zone="UPPER_THRESHOLD_ZONE","Changed")
|eval time_off=if(message=="OFF",_time,null())
|filldown time_off
| eval diff=if(def=="Changed",_time-time_off,null())
| chart sum(diff) by Device_ID, sensor
This is the query I have tried.
Expectation:
Grouped bar plot showing the proportion/amount of time an individual handset's systems spends within each Thermal zone.
X axis - Thermal zone (different zones)
Y axis - proportion/amount of time spent in Thermal zone "x"
Grouping - System being tracked (list of systems to the left)
Include ability to filter/search for which device ID is being shown. I envision only one device able to be shown at once.
Also want to be able to filter data by timeframe and/or ability to select individual inspections / boot cycles
- Mark as New
- Bookmark Message
- Subscribe to Message
- Mute Message
- Subscribe to RSS Feed
- Permalink
- Report Inappropriate Content
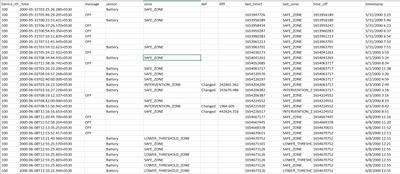
The _time you have displayed does not match the last_time1 or time_off in the corresponding events i.e. last_time1 and time_off are in 2022, whereas _time is in 2000. Please can you clarify what is actually in your events and exactly what SPL you used to generate the table in the graphic?
- Mark as New
- Bookmark Message
- Subscribe to Message
- Mute Message
- Subscribe to RSS Feed
- Permalink
- Report Inappropriate Content
actually I have attached sample. You can consider year as "2002" instead of 2000.
|rex field=_raw "(?<message>OFF.*)|((?<sensor>Battery).*?(?<zone>\w+_ZONE))"
|eval Device_ID=mvindex(split(source,"/"),5)
|table Device_ID _time message sensor zone
|where isnotnull(sensor) OR isnotnull(zone) OR isnotnull(message)
|sort 0 Device_ID _time
|streamstats current=f last(_time) as last_time1 last(zone) as last_zone by Device_ID
|eval timestamp=strftime(last_time1,"%Y-%m-%d %H:%M:%S")
|eval def=case(zone="INTERVENTION_ZONE" AND last_zone="SAFE_ZONE","Changed",zone="SAFE_ZONE" AND last_zone="INTERVENTION_ZONE","Changed",zone="LOWER_THRESHOLD_ZONE" AND last_zone="UPPER_THRESHOLD_ZONE","Changed")
|eval time_off=if(message=="OFF",_time,null())
|filldown time_off
| eval diff=if(def=="Changed",_time-time_off,null())
| chart sum(diff) by Device_ID, sensor
- Mark as New
- Bookmark Message
- Subscribe to Message
- Mute Message
- Subscribe to RSS Feed
- Permalink
- Report Inappropriate Content
OK, ignoring the graphic since the dates are clearly wrong, try something like this
|rex field=_raw "(?<message>OFF.*)|((?<sensor>Battery).*?(?<zone>\w+_ZONE))"
|eval Device_ID=mvindex(split(source,"/"),5)
|table Device_ID _time message sensor zone
|where isnotnull(sensor) OR isnotnull(zone) OR isnotnull(message)
|sort 0 Device_ID _time
|streamstats current=f last(zone) as last_zone by Device_ID
|eval def=case(zone="INTERVENTION_ZONE" AND last_zone="SAFE_ZONE","Changed",zone="SAFE_ZONE" AND last_zone="INTERVENTION_ZONE","Changed",zone="LOWER_THRESHOLD_ZONE" AND last_zone="UPPER_THRESHOLD_ZONE","Changed")
|eval time_off=if(message=="OFF",_time,null())
|streamstats current=f last(time_off) as last_time_off by Device_ID
| eval diff=if(def=="Changed",_time-last_time_off,null())
| chart sum(diff) by Device_ID, sensor- Mark as New
- Bookmark Message
- Subscribe to Message
- Mute Message
- Subscribe to RSS Feed
- Permalink
- Report Inappropriate Content
to capture the proportion of time the device spends within each temperature zone. The way you could calculate this is by taking the difference between the timestamps indicating changes to different temp zones. Then, we will have the proportion of time the different locations (battery, etc.) spent at each temp zone (proportions add up to 1 for each individual device). So this would be interesting to see if there are devices that spend an uncharacteristically high amount of time in the “failsafe” zone, and things of that sort.

