Join the Conversation
- Find Answers
- :
- Using Splunk
- :
- Splunk Search
- :
- How to calculate and display unique combinations w...
- Subscribe to RSS Feed
- Mark Topic as New
- Mark Topic as Read
- Float this Topic for Current User
- Bookmark Topic
- Subscribe to Topic
- Mute Topic
- Printer Friendly Page
- Mark as New
- Bookmark Message
- Subscribe to Message
- Mute Message
- Subscribe to RSS Feed
- Permalink
- Report Inappropriate Content
Let's say I want to display the total number of unique possible combinations for a given set of things (n) when various amounts (r) of those things are chosen. You cannot choose the same thing more than once and it does not matter which order those things are chosen in.
For example, I have 13 searches that contribute to a user's risk score (n=13). Right now my users' behavior has triggered a maximum of 6 of those searches (r=6). However, each user may have triggered a different combination of 6 searches from the 13 total possible searches.
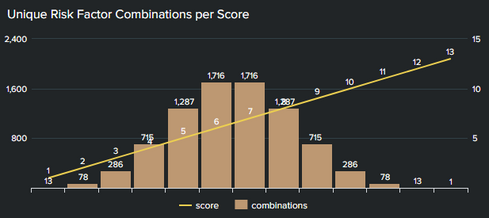
How can I calculate and display for each risk score (1-13) the number of unique combinations of searches that could contribute to the score?
For example, if a user has a risk score of 13, there is only 1 combination, all 13 searches. If a user has a score of 1 there are 13 possible combinations.
I want to be able to dynamically calculate and display all the rest of the possibilities without statically defining n or r.
This is the formula I am using: n!/(r!(n-r)!)
- Mark as New
- Bookmark Message
- Subscribe to Message
- Mute Message
- Subscribe to RSS Feed
- Permalink
- Report Inappropriate Content
Based on this solution by @javiergn: https://community.splunk.com/t5/Splunk-Search/How-to-calculate-the-factorial-of-a-number-in-a-Splunk...
(Not entirely sure what the hell natural logarithm and exponential function e^x are but I double checked all the math with an online calculator and it works. I don't know what the upper limit on "n" and/or "r" would be with this solution, but there is a point at which the numbers are too big and the math starts to break down according to @javiergn.)
Here is the visualization, I really like how it came out:
Here is the SPL, you can insert anything in place of the lookup table files in order to dynamically calculate your "n" and "r":
| inputlookup my_list_of_things.csv
| stats dc(factor) as n
| eval r=mvrange(1,('n'+1))
| mvexpand r
| eval r_log=ln('r')
| eventstats sum(r_log) as n_sum
| eval n_factorial=exp('n_sum')
| streamstats sum(r_log) as r_sum
| eval r_factorial=exp('r_sum')
| eval nlr='n'-'r'
| eval nlr_log=ln('nlr')
| sort + nlr
| streamstats sum(nlr_log) as nlr_sum
| eval nlr_factorial=exp('nlr_sum')
| eval combinations=round(('n_factorial'/('r_factorial'*'nlr_factorial')))
| eval combinations=if('n'=='r',1,'combinations')
| rename n as factors r as score
| sort + score
| table factors score combinations
- Mark as New
- Bookmark Message
- Subscribe to Message
- Mute Message
- Subscribe to RSS Feed
- Permalink
- Report Inappropriate Content
Thanks to @martin_mueller there's now "an app for that": https://splunkbase.splunk.com/app/5568/ 😍
- Mark as New
- Bookmark Message
- Subscribe to Message
- Mute Message
- Subscribe to RSS Feed
- Permalink
- Report Inappropriate Content
There are two more, significantly less SPL-intense options:
- Cheat. Given the restrictions of finite-bit maths, you can easily ship a lookup of all reasonable factorials instead of calculating them on the fly, here's a start: https://oeis.org/A000142/list
- Use Stirling's approximation, expressed in SPL it's `| eval n! = sqrt(2*pi()*n)*pow(n/exp(1), n)` ... it won't be perfect, but it'll give you the right number of digits and the first two will be accurate, ie two sigfigs of precision. Probably good enough for your use case, for 13 choose 6 it yields 1749.
- Mark as New
- Bookmark Message
- Subscribe to Message
- Mute Message
- Subscribe to RSS Feed
- Permalink
- Report Inappropriate Content
Based on this solution by @javiergn: https://community.splunk.com/t5/Splunk-Search/How-to-calculate-the-factorial-of-a-number-in-a-Splunk...
(Not entirely sure what the hell natural logarithm and exponential function e^x are but I double checked all the math with an online calculator and it works. I don't know what the upper limit on "n" and/or "r" would be with this solution, but there is a point at which the numbers are too big and the math starts to break down according to @javiergn.)
Here is the visualization, I really like how it came out:
Here is the SPL, you can insert anything in place of the lookup table files in order to dynamically calculate your "n" and "r":
| inputlookup my_list_of_things.csv
| stats dc(factor) as n
| eval r=mvrange(1,('n'+1))
| mvexpand r
| eval r_log=ln('r')
| eventstats sum(r_log) as n_sum
| eval n_factorial=exp('n_sum')
| streamstats sum(r_log) as r_sum
| eval r_factorial=exp('r_sum')
| eval nlr='n'-'r'
| eval nlr_log=ln('nlr')
| sort + nlr
| streamstats sum(nlr_log) as nlr_sum
| eval nlr_factorial=exp('nlr_sum')
| eval combinations=round(('n_factorial'/('r_factorial'*'nlr_factorial')))
| eval combinations=if('n'=='r',1,'combinations')
| rename n as factors r as score
| sort + score
| table factors score combinations
- Mark as New
- Bookmark Message
- Subscribe to Message
- Mute Message
- Subscribe to RSS Feed
- Permalink
- Report Inappropriate Content
After working on all this I did come across mvmap which could possibly be used to simplify all the steps involved but I haven't tried it out yet: https://docs.splunk.com/Documentation/Splunk/8.0.6/SearchReference/MultivalueEvalFunctions#mvmap.28X...


