Join the Conversation
- Find Answers
- :
- Using Splunk
- :
- Splunk Search
- :
- How do you pull field values from an outer query t...
- Subscribe to RSS Feed
- Mark Topic as New
- Mark Topic as Read
- Float this Topic for Current User
- Bookmark Topic
- Subscribe to Topic
- Mute Topic
- Printer Friendly Page
- Mark as New
- Bookmark Message
- Subscribe to Message
- Mute Message
- Subscribe to RSS Feed
- Permalink
- Report Inappropriate Content
I have a log file from which I extract the below table of test results, where each test result row describes a particular test status (PASS OR FAIL) and shows test start and end times.
Action      Status      startTime               endTime

    TEST_1      Success     1540031963.935      1540032192.644
    TEST_2      Success     1540030901.177      1540031831.031
    TEST_3      Success     1540030639.272      1540030890.771
    TEST_4      Success     1540030498.098      1540030628.755
    TEST_5      Success     1540030046.730      1540030487.604
    TEST_6      Fail               1540028918.752       1540030040.026
For each test result or row, I would like to show a count for number of exceptions encountered during that test that is between start and end time for that test and be able to disable table as such:
Action      Status      startTime       endTime         ExceptionCount

TEST_1      Success     1540031963.935      1540032192.644      10
TEST_2      Success     1540030901.177      1540031831.031      20
TEST_3      Success     1540030639.272      1540030890.771      0
TEST_4      Success     1540030498.098      1540030628.755      1
TEST_5      Success     1540030046.730      1540030487.604      0
TEST_6      Fail                1540028918.752      1540030040.026      15
I use the map command to iterate over each row/test result and use the rex command to parse and count exceptions between earliest and latest whose values come from the row's start and end times. This is working but I don't know how to pull in the value of Action and Status field from the outer query.
    index=myIndex host=abc sourcetype=AbcServer source="/opt/*"   "Test Result:" | rex .*"Action: "(?\w+).*", Test Result: "(?\w+).*", Start Time: "(?\d+\.\d+)", End Time: "(?\d+\.\d+)
    | table Action Status startTime endTime
    | map maxsearches=1000 search="search index=myIndex host=abc  sourcetype=AbcServer earliest=$startTime$ latest=$endTime$ *Exception | rex .*\": (?[\w\.]*Exception)\"
    | stats count(exceptionClass) as CNT"
    | table Action Status CNT
Action      Status      CNT

                                10
                                20
                                0
                                1
                                0
                                 15
Any thoughts on how to get Action and Status values into final result?
Thanks
- Mark as New
- Bookmark Message
- Subscribe to Message
- Mute Message
- Subscribe to RSS Feed
- Permalink
- Report Inappropriate Content
@bobkaz , you can try using Action and Status in the map command like the following and perform the stats by the two fields.
 | eval Action=\"$Action$\", Status=\"$Status$\"
 | stats count(exceptionClass) as CNT" by Action Status
Following is the one SPL based on existing search ( I think some of the characters in your post do not show up as expected).
 index=myIndex host=abc sourcetype=AbcServer source="/opt/*"   "Test Result:" | rex .*"Action: "(?\w+).*", Test Result: "(?\w+).*", Start Time: "(?\d+\.\d+)", End Time: "(?\d+\.\d+)
 | table Action Status startTime endTime
 | map maxsearches=1000 search="search index=myIndex host=abc  sourcetype=AbcServer earliest=$startTime$ latest=$endTime$ *Exception | rex .*\": (?[\w\.]*Exception)\"
 | eval Action=\"$Action$\", Status=\"$Status$\"
 | stats count(exceptionClass) as CNT" by Action Status
 | table Action Status CNT
However, do give sample events for Exceptions corresponding to a test case so that we can assist you with any other approach as map could be an expensive command for correlation your use case.
| makeresults | eval message= "Happy Splunking!!!"
- Mark as New
- Bookmark Message
- Subscribe to Message
- Mute Message
- Subscribe to RSS Feed
- Permalink
- Report Inappropriate Content
Hi niketnilay,
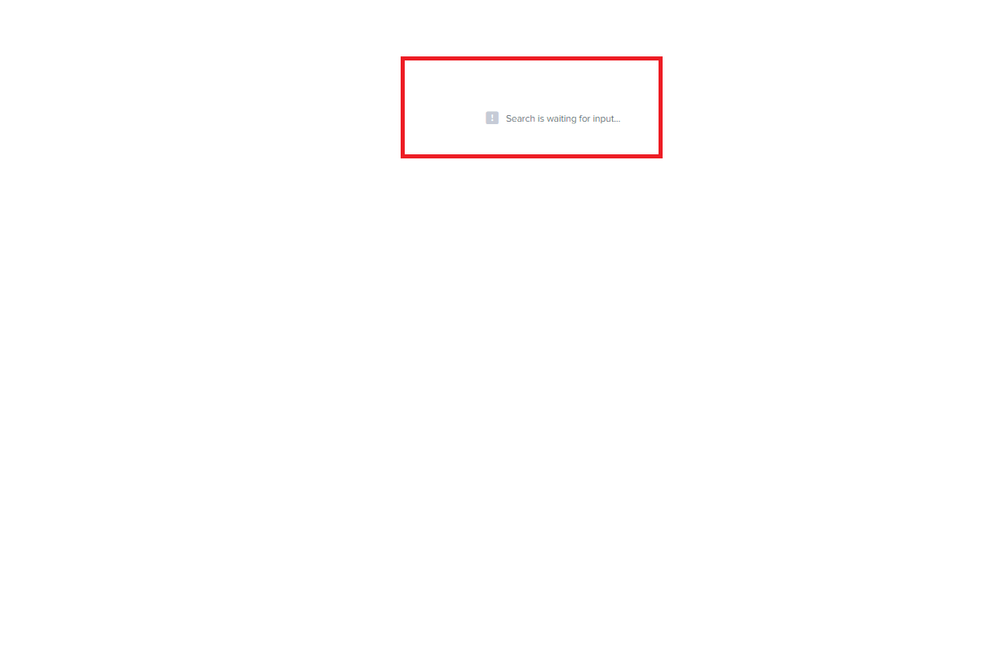
Thanks for your suggestion, I tweaked my SPL accordingly and it now runs successfully. However, when I add it to a statistics panel in the dashboard, it doesn't run and keeps saying "waiting for input", see attached picture.
SPL:
index=nsplogs host=hostA sourcetype=serverLog source="/opt/*"  "Test Result:"
  | rex .*"Action: "(?\w+).*", Test Result: "(?\w+).*", Start Time: "(?\d+\.\d+)", End Time: "(?(\d+\.\d+)).*
  | table Action Status startTime endTime
  | map maxsearches=1000 search="search index=nsplogs host=hostB sourcetype=serverLog earliest=$startTime$ latest=$endTime$ *Exception
  | rex .*\": (?[\w\.]*Exception)\" | eval Action=\"$Action$\", Status=\"$Status$\", startTime=\"$startTime$\", endTime=\"$endTime$\"
  | stats count(exceptionClass) as ExceptionCount by Action Status"
  | table Action Status ExceptionCount
Note that values of host attribute reflect real server names and aren't parametrized or are not tokens, so I don't know what input it is waiting for.
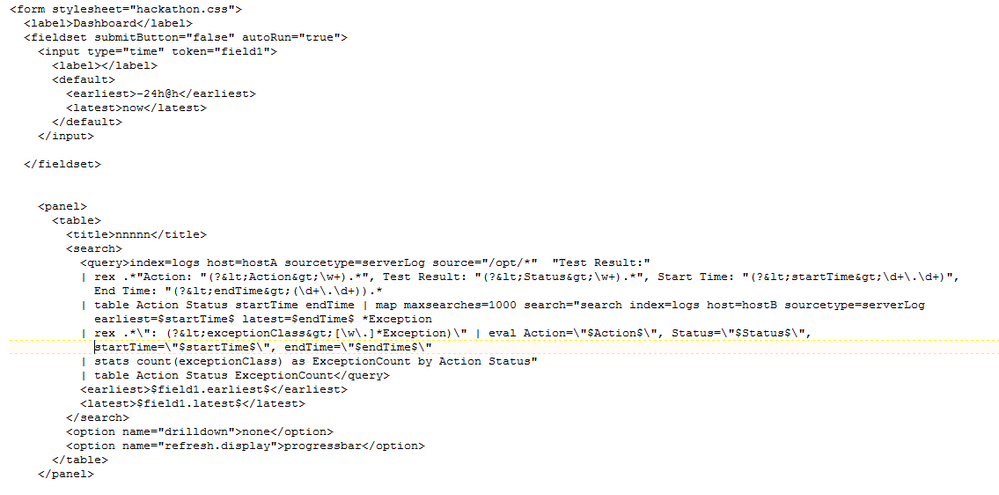
Attached is a picture showing dashboard source code.
Any thoughts?
Thanks
- Mark as New
- Bookmark Message
- Subscribe to Message
- Mute Message
- Subscribe to RSS Feed
- Permalink
- Report Inappropriate Content
@bobkaz, the $ in the map command needs to be escaped in dashboard by prefixing with another $ sign. Refer to one of my previous answers: https://answers.splunk.com/answers/680801/why-is-the-search-using-map-wont-work-in-dashboard.html
Please try out and confirm! Do up vote if it helps 🙂
| makeresults | eval message= "Happy Splunking!!!"
- Mark as New
- Bookmark Message
- Subscribe to Message
- Mute Message
- Subscribe to RSS Feed
- Permalink
- Report Inappropriate Content
Hi niketnilay,
I figured out the problem. I had to replace every $ with $$ inside map command for SPL to work inside dashboard panel. Below is my working SPL:
index=nsplogs host=hostA sourcetype=serverLog source="/opt/" "Test Result:"
| rex ."Action: "(?\w+).", Test Result: "(?\w+).", Start Time: "(?\d+.\d+)", End Time: "(?(\d+.\d+)).*
| table Action Status startTime endTime
| map maxsearches=1000 search="search index=nsplogs host=hostB sourcetype=serverLog earliest=$$startTime$$ latest=$$endTime$$ Exception
| rex .\": (?[\w.]*Exception)\" | eval Action=\"$$Action$$\", Status=\"$$Status$$\", startTime=\"$$startTime$$\", endTime=\"$$endTime$$\"
| stats count(exceptionClass) as ExceptionCount by Action Status"
| table Action Status ExceptionCount
Thanks a lot for your help, truly appreciated!


