Are you a member of the Splunk Community?
- Find Answers
- :
- Using Splunk
- :
- Splunk Search
- :
- Re: How do I display values over the last 24 hours...
- Subscribe to RSS Feed
- Mark Topic as New
- Mark Topic as Read
- Float this Topic for Current User
- Bookmark Topic
- Subscribe to Topic
- Mute Topic
- Printer Friendly Page
- Mark as New
- Bookmark Message
- Subscribe to Message
- Mute Message
- Subscribe to RSS Feed
- Permalink
- Report Inappropriate Content
Greetings,
I am trying to display the value of "002:emailsqu=33" over the last 24 hours and then graph it. The log comes in to the system every 180seconds
Date=Wednesday, September 9, 2015 3:10:37 PM
Location=ImageNowProduction
001:sizebundle=21
002:emailsqu=33
003:createdocumentqu=44
Many Thanks 🙂
- Mark as New
- Bookmark Message
- Subscribe to Message
- Mute Message
- Subscribe to RSS Feed
- Permalink
- Report Inappropriate Content
I used the Pivot function with the MEDIAN option in the end, seems to be working well. Thanks for all the replies 🙂
- Mark as New
- Bookmark Message
- Subscribe to Message
- Mute Message
- Subscribe to RSS Feed
- Permalink
- Report Inappropriate Content
I used the Pivot function with the MEDIAN option in the end, seems to be working well. Thanks for all the replies 🙂
- Mark as New
- Bookmark Message
- Subscribe to Message
- Mute Message
- Subscribe to RSS Feed
- Permalink
- Report Inappropriate Content
If emailsqu is already extracted as a field:
earliest=-24h sourcetype=foo emailsqu=* | table emailsqu _time
or
earliest=-24h sourcetype=foo emailsqu=* | timechart span=2m max(emailsqu) as emailsqu
or you could use a different span and use avg instead of max for example.
If emailsqu is not extracted as a field:
earliest=-24h sourcetype=foo | rex "emailsqu=(?<emailsqu>.*) | table emailsqu _time
or
earliest=-24h sourcetype=foo | rex "emailsqu=(?<emailsqu>.*) | timechart span=2m max(emailsqu) as emailsqu
- Mark as New
- Bookmark Message
- Subscribe to Message
- Mute Message
- Subscribe to RSS Feed
- Permalink
- Report Inappropriate Content
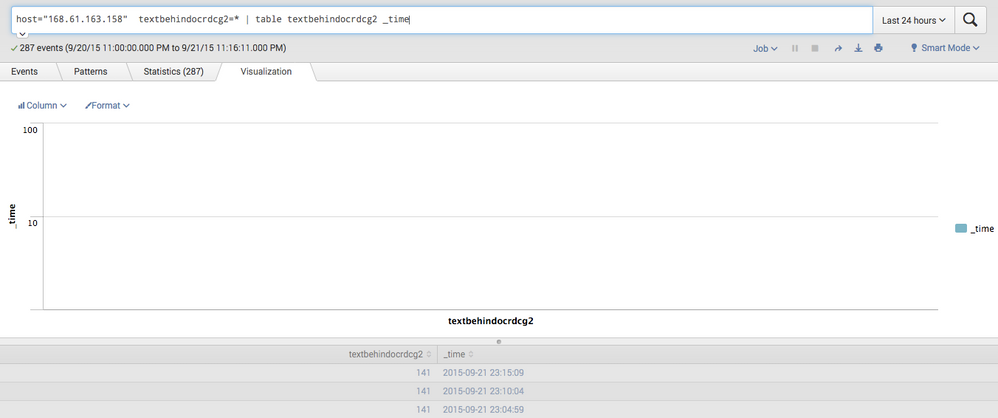
Thanks for the reply 🙂 see the attached screen shot i seem to be getting the data into the fields but i cant graph it for my dashboard
any ideas ?
Many thanks as always

- Mark as New
- Bookmark Message
- Subscribe to Message
- Mute Message
- Subscribe to RSS Feed
- Permalink
- Report Inappropriate Content
try timechart instead of table
.... | timechart values(textbehindocrdcg2) AS textbehindocrdcg2
cheers, MuS
- Mark as New
- Bookmark Message
- Subscribe to Message
- Mute Message
- Subscribe to RSS Feed
- Permalink
- Report Inappropriate Content
Hi @loggeruk,
I'm a tech writer here at Splunk and I'd like to help. If I'm understanding your question, it sounds like you might want to run a query using a command like "timechart" to aggregate on the "002:emailsqu=33" field in your data , with the time picker set to "Last 24 hours". You can then set up a visualization, such as a line graph, to visualize the results.
Here are some resources that might help:
http://docs.splunk.com/Documentation/Splunk/6.2.5/SearchReference/Timechart
http://docs.splunk.com/Documentation/Splunk/6.2.5/SearchTutorial/Aboutthetimerangepicker
http://docs.splunk.com/Documentation/Splunk/6.2.5/Viz/ChartConfigurationReference#Area.2C_Bubble.2C_...
I hope this helps! If not, let me know and we can keep discussing.
All the best,
@frobinson_splunk
