- Find Answers
- :
- Using Splunk
- :
- Splunk Search
- :
- How can i create a stacked bar graph showing the d...
- Subscribe to RSS Feed
- Mark Topic as New
- Mark Topic as Read
- Float this Topic for Current User
- Bookmark Topic
- Subscribe to Topic
- Mute Topic
- Printer Friendly Page
- Mark as New
- Bookmark Message
- Subscribe to Message
- Mute Message
- Subscribe to RSS Feed
- Permalink
- Report Inappropriate Content
How can i create a stacked bar graph showing the different log levels (Error, Info, Debug) generated by each Process
index="intau_workfusion" sourcetype=workfusion.out.log host=*
| rex "^(?<Date>\d+-\d+-\d+\s+\d+:\d+:\d+)\s+\[[^\]]*\]\s*\[(?<Process>[^\]]*)\]\s*\[(?<Step>[^\]]*)\]\s*\[(?<User>[^\]]*)\]\s*[^\[]+\s\[(?<Log_level>[^\]]+)"
| search Log_level="*"
| where Process != ""
- Mark as New
- Bookmark Message
- Subscribe to Message
- Mute Message
- Subscribe to RSS Feed
- Permalink
- Report Inappropriate Content
Try using the chart command to get both Log_level and Process in the output.
index="intau_workfusion" sourcetype=workfusion.out.log host=*
| rex "^(?<Date>\d+-\d+-\d+\s+\d+:\d+:\d+)\s+\[[^\]]*\]\s*\[(?<Process>[^\]]*)\]\s*\[(?<Step>[^\]]*)\]\s*\[(?<User>[^\]]*)\]\s*[^\[]+\s\[(?<Log_level>[^\]]+)"
| search Log_level="*"
| where Process != ""
| chart count over Process by Log_level
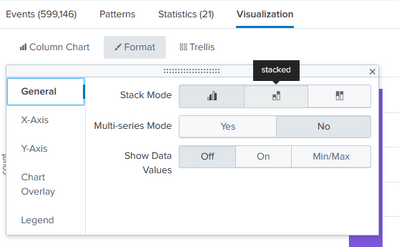
To see the chart, switch to the Visualization tab, choose the "Column Chart" visualization, then select "Stacked" from the Format dropdown. See the example below.
If this reply helps you, Karma would be appreciated.
- Mark as New
- Bookmark Message
- Subscribe to Message
- Mute Message
- Subscribe to RSS Feed
- Permalink
- Report Inappropriate Content
Charts require a command that produces statistics (chart, stats, timechart, etc.). Try this
index="intau_workfusion" sourcetype=workfusion.out.log host=*
| rex "^(?<Date>\d+-\d+-\d+\s+\d+:\d+:\d+)\s+\[[^\]]*\]\s*\[(?<Process>[^\]]*)\]\s*\[(?<Step>[^\]]*)\]\s*\[(?<User>[^\]]*)\]\s*[^\[]+\s\[(?<Log_level>[^\]]+)"
| search Log_level="*"
| where Process != ""
| stats count by Log_level
Then switch to the Visualization tab, choose the Bar Chart visualization, then select the Stacked format.
If this reply helps you, Karma would be appreciated.
- Mark as New
- Bookmark Message
- Subscribe to Message
- Mute Message
- Subscribe to RSS Feed
- Permalink
- Report Inappropriate Content
I have applied it but but its only showin like this, I want the log level to be stacked and to show according to Process
- Mark as New
- Bookmark Message
- Subscribe to Message
- Mute Message
- Subscribe to RSS Feed
- Permalink
- Report Inappropriate Content
Try using the chart command to get both Log_level and Process in the output.
index="intau_workfusion" sourcetype=workfusion.out.log host=*
| rex "^(?<Date>\d+-\d+-\d+\s+\d+:\d+:\d+)\s+\[[^\]]*\]\s*\[(?<Process>[^\]]*)\]\s*\[(?<Step>[^\]]*)\]\s*\[(?<User>[^\]]*)\]\s*[^\[]+\s\[(?<Log_level>[^\]]+)"
| search Log_level="*"
| where Process != ""
| chart count over Process by Log_level
To see the chart, switch to the Visualization tab, choose the "Column Chart" visualization, then select "Stacked" from the Format dropdown. See the example below.
If this reply helps you, Karma would be appreciated.


