
Join the Conversation
- Find Answers
- :
- Using Splunk
- :
- Splunk Search
- :
- Re: How can I create a bar chart through 4 fields?
- Subscribe to RSS Feed
- Mark Topic as New
- Mark Topic as Read
- Float this Topic for Current User
- Bookmark Topic
- Subscribe to Topic
- Mute Topic
- Printer Friendly Page
- Mark as New
- Bookmark Message
- Subscribe to Message
- Mute Message
- Subscribe to RSS Feed
- Permalink
- Report Inappropriate Content

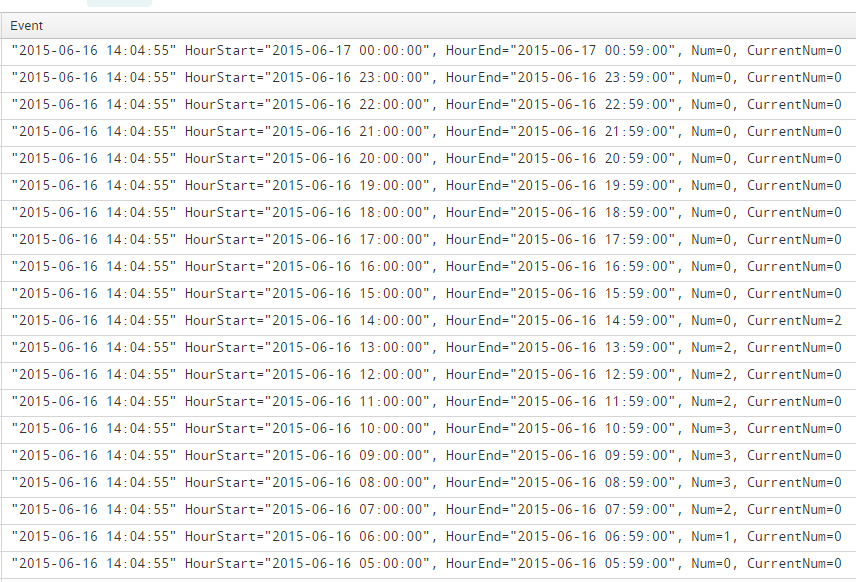
I'm using db Connect and I have this db input. So, I want a chart with 24 bars that represent range of hours. HourStart and HourEnd are that range and I get them in my query. For each interval (HourStart - HourEnd) I have Num which I also get it in my result. CurrentNum is used just for the current interval. For instance, now the current interval is 10AM - 11AM, so only for this interval CurrentNum will be used; the remains will be represented by 'Num' .
- Mark as New
- Bookmark Message
- Subscribe to Message
- Mute Message
- Subscribe to RSS Feed
- Permalink
- Report Inappropriate Content

OK, try this (HourEnd is implied by HourStart so it does not factor in):
... | chart avg(Num) AS Num avg(CurrentNum) AS CurrentNum over HourStart
- Mark as New
- Bookmark Message
- Subscribe to Message
- Mute Message
- Subscribe to RSS Feed
- Permalink
- Report Inappropriate Content
OK, try this (HourEnd is implied by HourStart so it does not factor in):
... | chart avg(Num) AS Num avg(CurrentNum) AS CurrentNum over HourStart
- Mark as New
- Bookmark Message
- Subscribe to Message
- Mute Message
- Subscribe to RSS Feed
- Permalink
- Report Inappropriate Content
For each, HourStart there is the specified value of Num
- Mark as New
- Bookmark Message
- Subscribe to Message
- Mute Message
- Subscribe to RSS Feed
- Permalink
- Report Inappropriate Content
Right; that's what is charted. If that is not what you desire, you need to restate your desire MUCH more clearly. I have been making educated guesses because you still have never been clear about what you are trying to do.
- Mark as New
- Bookmark Message
- Subscribe to Message
- Mute Message
- Subscribe to RSS Feed
- Permalink
- Report Inappropriate Content
I really appreciate your suggestions! I'll try to explain again what I desire. Thanks
- Mark as New
- Bookmark Message
- Subscribe to Message
- Mute Message
- Subscribe to RSS Feed
- Permalink
- Report Inappropriate Content
Like this?
... | timechart first(HourStart) , first(HourEnd), first(Num), first(CurrentNum)
To make the visualization a bar chart, modify with the upper-left control and change it to "bar" or "column".
This is probably a poor guess at an answer but you have neither shown us your data, nor your search as it is so-far.



Join the Splunk Community Slack to learn, troubleshoot, and make connections with fellow Splunk practitioners in real time!
Join Splunk User Groups to connect and learn in-person by region or remotely by topic or industry.
Vibe-coding, AI, and Splunkcraft: Highlights from the .conf26 Builder Bar
Thanks for the Memories: .conf26 Took Learning to New Heights
Best Practices: Splunk auto adjust pipeline queue
