- Splunk Answers
- :
- Using Splunk
- :
- Splunk Search
- :
- Help with Chart overlay over Bar chart
- Subscribe to RSS Feed
- Mark Topic as New
- Mark Topic as Read
- Float this Topic for Current User
- Bookmark Topic
- Subscribe to Topic
- Mute Topic
- Printer Friendly Page
- Mark as New
- Bookmark Message
- Subscribe to Message
- Mute Message
- Subscribe to RSS Feed
- Permalink
- Report Inappropriate Content
Help with Chart overlay over Bar chart
Hi All,
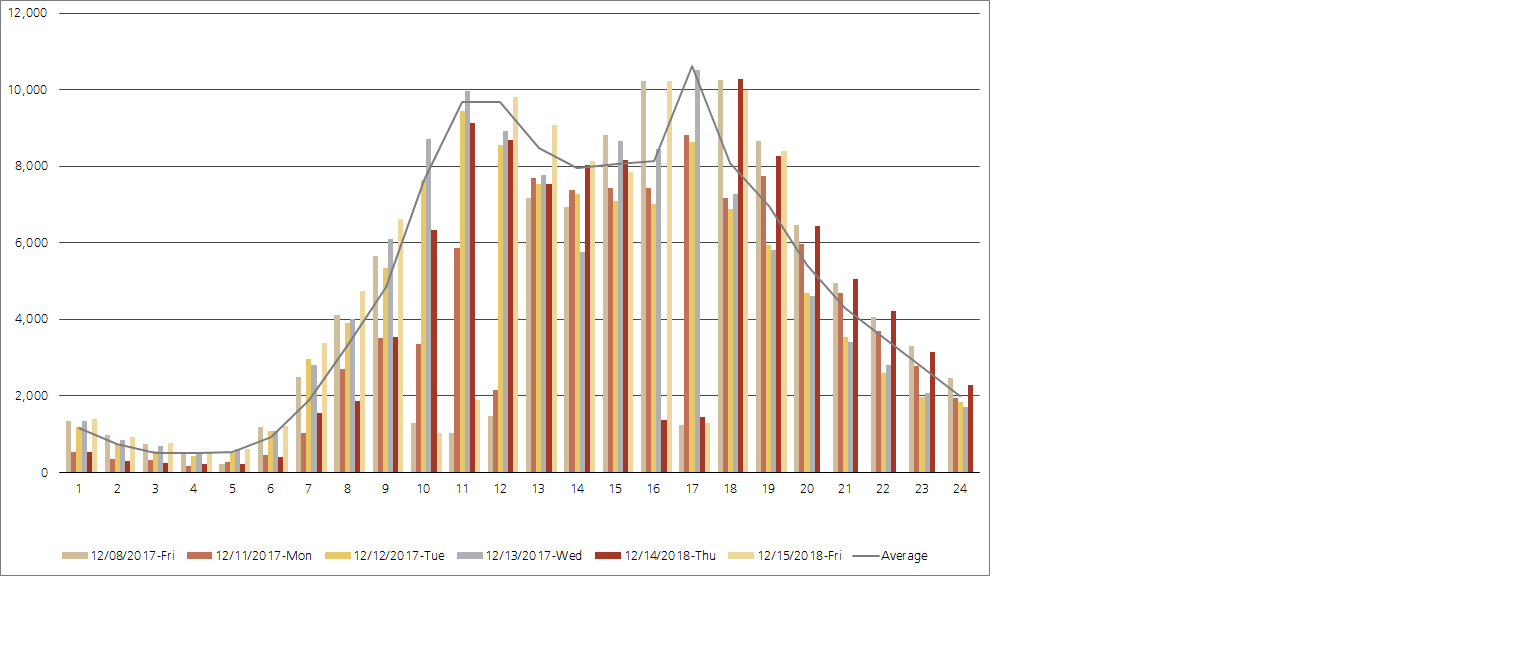
Need help in building below visualization having overlay.
x-axis - represents hour [24 hour format]
y-axis -shows the distinct count
single hour should be able to show the counts for different dates.
overlay should show the average count
I have lookup which has average, i am willing to use this lookup.
Below is my xyseries search,i am unable to get the overlay either with xyseries or stats command. i am unable to get "AvgUserCount" field values in overlay field name
index=abc | eval tmfrmt_date=strftime(_time,"%Y-%m-%d") | eval tmfrmt_hour=strftime(_time,"%H") | eval tmfrmt_wkday=strftime(_time,"%a") | stats dc(id) AS Unique_Users by tmfrmt_hour tmfrmt_date tmfrmt_wkday |search NOT(tmfrmt_wkday="sat") NOT(tmfrmt_wkday="sun") | table Unique_Users tmfrmt_date tmfrmt_hour | lookup avg.csv Hour as tmfrmt_hour OUTPUT AvgUserCount | table tmfrmt_hour Unique_Users tmfrmt_date AvgUserCount | xyseries tmfrmt_hour tmfrmt_date Unique_Users AvgUserCount
avg lookup has values as below[ values are cooked up]
Hour,AvgUserCount
![00,230
01,100
.
.
.23,270][1]
Any suggestions on how to get this done.
Thank you in advance.
Splunk version 6.5.2
- Mark as New
- Bookmark Message
- Subscribe to Message
- Mute Message
- Subscribe to RSS Feed
- Permalink
- Report Inappropriate Content
Hi,
Sorry i misunderstood your requirement - Anyway here's a sample code that I tried on internal splunk audit index, which you can also try as the audit index is available by default. A bit on mapping , I have taken the field 'user' for unique user , which is 'ip' in your case, rest all stays the same.
Now, you are using a lookup to calculate the hourly averages, for example,say for hour 10
if you have 3 days as columns something like
hour   day 1 day 2 day 3
10       2        3          4
You expect the average as 3 , which should also be available as an overlay field and that is probably why you are using a csv look up. Let splunk calculate this average for you..try
index="_audit" | eval tmfrmt_date=strftime(_time,"%Y-%m-%d") | eval tmfrmt_hour=strftime(_time,"%H") | eval tmfrmt_wkday=strftime(_time,"%a") | stats dc(user) AS Unique_Users by tmfrmt_hour tmfrmt_date tmfrmt_wkday |search NOT(tmfrmt_wkday="sat") NOT(tmfrmt_wkday="sun")| eventstats dc(tmfrmt_date) as col | xyseries tmfrmt_hour tmfrmt_date Unique_Users| addtotals | appendcols[search index="_audit" | eval tmfrmt_date=strftime(_time,"%Y-%m-%d") | eval tmfrmt_hour=strftime(_time,"%H") | eval tmfrmt_wkday=strftime(_time,"%a") | stats dc(user) AS Unique_Users by tmfrmt_hour tmfrmt_date tmfrmt_wkday |search NOT(tmfrmt_wkday="sat") NOT(tmfrmt_wkday="sun")| eventstats dc(tmfrmt_date) as col |table col]| where isnotnull(tmfrmt_hour)| eval avg=(Total-tmfrmt_hour)/col | fields - col,Total
Mapping
id - user
AvgUserCount - avg
Now, when you go to the visualization you can select avg as an overlay. If possible avoid using a lookup csv, merely to calculate the average over hours over days, let splunk calculate it real time
- Mark as New
- Bookmark Message
- Subscribe to Message
- Mute Message
- Subscribe to RSS Feed
- Permalink
- Report Inappropriate Content
i am willing to follow any other approach if needed to achieve this.
- Mark as New
- Bookmark Message
- Subscribe to Message
- Mute Message
- Subscribe to RSS Feed
- Permalink
- Report Inappropriate Content
hmm what if you use |trendline sma2(Unique_Users) as AvgUserCount
Then try adding the trendline field - AvgUserCount as an overlay?
- Mark as New
- Bookmark Message
- Subscribe to Message
- Mute Message
- Subscribe to RSS Feed
- Permalink
- Report Inappropriate Content
thanks for the response. I need the average of the hour across the time range the trendline is giving me average for the specific hour+date combination , yes the field is listed in overlay option but the dates spread out for the hour is going off i.e. I no longer see the dates with in the hour.
Built-in Service Level Objectives Management to Bridge the Gap Between Service & ...
Get Your Exclusive Splunk Certified Cybersecurity Defense Engineer Certification at ...
Share Your Ideas & Meet the Lantern team at .Conf! Plus All of This Month’s New ...
