Are you a member of the Splunk Community?
- Find Answers
- :
- Using Splunk
- :
- Splunk Search
- :
- Help showing top tenants by number of hosts in pie...
- Subscribe to RSS Feed
- Mark Topic as New
- Mark Topic as Read
- Float this Topic for Current User
- Bookmark Topic
- Subscribe to Topic
- Mute Topic
- Printer Friendly Page
- Mark as New
- Bookmark Message
- Subscribe to Message
- Mute Message
- Subscribe to RSS Feed
- Permalink
- Report Inappropriate Content
Help showing top tenants by number of hosts in pie chart
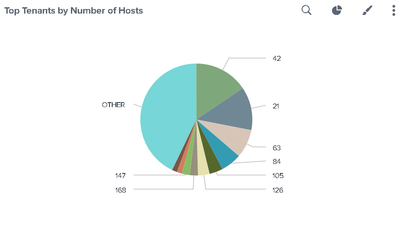
I would like to make a pie chart which shows the Top 10 tenants by number of hosts and then put everything else under the label "other".
Currently, I am doing this:
| stats sum(hostsCount) as hostsCount by TenantName
| sort hostsCount desc
The issue with this is that it truncates the TenantNames to 10000 as shown in the screenshot which makes the "other" category's hostsCount not accurate. There are over 30000 TenantNames/hostsCount.
I would like to change this Pie chart to:
1. Display the Top 10 tenants by hostsCount
2. Make a label called "other" and put all the remaining hostsCounts in them so that it displays the accurate percentage/amount.
What would be the best way to do this?
- Mark as New
- Bookmark Message
- Subscribe to Message
- Mute Message
- Subscribe to RSS Feed
- Permalink
- Report Inappropriate Content
hi @marcorivera
apologies i read the question wrong you can ignore the top command
your earlier query is correct
If you save the piechart in a dashboard, and then you can use the charting.data.count option to set a higher limit (even unlimited (0)).
https://docs.splunk.com/Documentation/SplunkCloud/8.2.2202/Viz/ChartConfigurationReference
P.S if it helps karma points are appreciated
- Mark as New
- Bookmark Message
- Subscribe to Message
- Mute Message
- Subscribe to RSS Feed
- Permalink
- Report Inappropriate Content
Hi @marcorivera
just try
your search | top limit=10 useother=true hostsCount
if it helps karma points are appreciated /if it resolves solution acceptance is appreciated
- Mark as New
- Bookmark Message
- Subscribe to Message
- Mute Message
- Subscribe to RSS Feed
- Permalink
- Report Inappropriate Content
@venky1544 Sorry, I'm new to Splunk.. when I tried putting the "| top limit=10..." command at the bottom, it did not work and resulted into this. Am I doing it incorrectly?


