- Splunk Answers
- :
- Using Splunk
- :
- Splunk Search
- :
- Filter the Splunk results into a visualization
- Subscribe to RSS Feed
- Mark Topic as New
- Mark Topic as Read
- Float this Topic for Current User
- Bookmark Topic
- Subscribe to Topic
- Mute Topic
- Printer Friendly Page
- Mark as New
- Bookmark Message
- Subscribe to Message
- Mute Message
- Subscribe to RSS Feed
- Permalink
- Report Inappropriate Content
I have Splunk results in following format:
2021-11-13 01:02:50.127 ERROR 23 --- [ taskExecutor-2] c.c.p.r.service.RedisService             : The Redis Cache had no record for key: null Returning empty list.

2021-10-22 21:11:51.996 ERROR 22 --- [ taskExecutor-1] c.c.p.r.service.SftpService           : Could not delete file: /-/XYZ.FILE - 4: Failure

2021-10-22 02:05:14.426 ERROR 22 --- [ taskExecutor-1] c.c.p.r.service.SftpService           : Could not delete file: /-/XYZ.FILE - 4: Failure
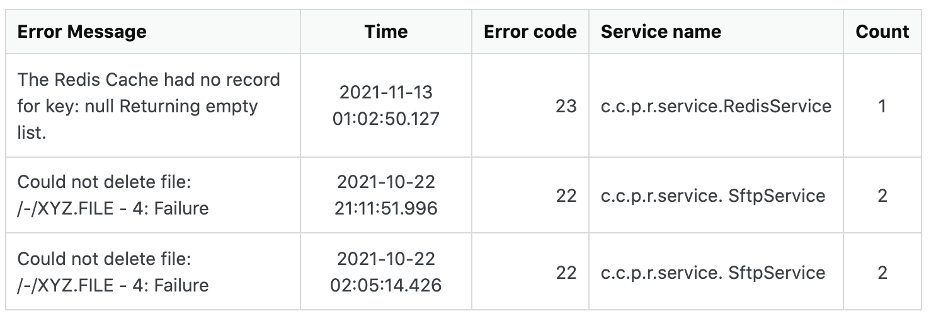
I want to create a Visualization in the following format - In the attached screenshot.
The **count variable** is based on the "Error Message" only. Since "Could not delete file: /-/XYZ.FILE - 4: Failure" appeared twice, hence the count is set to 2. As the logs grow, and this message occurrence increase, this count should increase too.
I tried using erex and substring from Splunk but kinda failed miserably!
Any help on how to form the Splunk query for this visualization would be appreciated.
Thanks
- Mark as New
- Bookmark Message
- Subscribe to Message
- Mute Message
- Subscribe to RSS Feed
- Permalink
- Report Inappropriate Content
This query works
index=rac_sd "ERROR * ---" "taskExecutor-*"
|  rex field=msg "^(?<Time>\S+\s+\S+)\s+\S+\s+(?<Error_Code>\d+)[^\]]+\]\s+(?<Service_Name>\S+)\s+:\s+(?<Error_Message>.+)"
| table Error_Message Time Error_Code Service_Name
| eventstats count as Count by Error_Message Error_Code Service_Name
| sort -Count
Thanks @somesoni2
- Mark as New
- Bookmark Message
- Subscribe to Message
- Mute Message
- Subscribe to RSS Feed
- Permalink
- Report Inappropriate Content
@somesoni2
I ran the query:
index=rac_sd | rex “^(?<Time>\S+\s+\S+)\s+\S+\s+(?<Error_Code>\d+)[^\]]+\]\s+(?<Service_Name>\S+)\:\s+(?<Error_Message>.+)”
| table Error_Message Time Error_Code Service_Name
| eventstats count as Count by Error_Message Error_Code Service_Name
Getting the error:
Error in 'SearchParser': Missing a search command before '^'. Error at position '76' of search query 'search index=rac_sd | rex “^(?<Time>\S+\s+\S+)\s...{snipped} {errorcontext = Code>\d+)[^\]]+\]\s+(}'.
- Mark as New
- Bookmark Message
- Subscribe to Message
- Mute Message
- Subscribe to RSS Feed
- Permalink
- Report Inappropriate Content
The double quotes may be causing the problem. Delete and re-type quotes and try again.
- Mark as New
- Bookmark Message
- Subscribe to Message
- Mute Message
- Subscribe to RSS Feed
- Permalink
- Report Inappropriate Content
Hey @somesoni2
Currently, I'm getting the results as the attached screenshot!
But if I want to don't wanna show multiple rows with same Error_message, as in, just one unique Error_message, and adding the times (of each of those rows with that Error_msg) in a list field separated by comma, like this in a table:
Error_msg: "Could not delete file: /-/PCS.P.KSZ4750J.TRIG.FILE - 4: Failure"
Count: 4
Service Name: "c.c.p.r.service.RpsSftpService"
Error code: 22
Time: "2021-11-16 22:23:54.905, 2021-11-18 22:23:31.511, 2021-11-17 22:23:31.511"
Can you please help enhance the query for the same?
- Mark as New
- Bookmark Message
- Subscribe to Message
- Mute Message
- Subscribe to RSS Feed
- Permalink
- Report Inappropriate Content
Try this
index=rac_sd "ERROR * ---" "taskExecutor-*"
|  rex field=msg "^(?<Time>\S+\s+\S+)\s+\S+\s+(?<Error_Code>\d+)[^\]]+\]\s+(?<Service_Name>\S+)\s+:\s+(?<Error_Message>.+)"
| table Error_Message Time Error_Code Service_Name
| stats last(Time) as Timr count as Count by Error_Message Error_Code Service_Name
| sort -Count
- Mark as New
- Bookmark Message
- Subscribe to Message
- Mute Message
- Subscribe to RSS Feed
- Permalink
- Report Inappropriate Content
@somesoni2 this works great but this is showing the time field as the last time.
But I want the all the times in a list for a row.
Reference: https://community.splunk.com/t5/Splunk-Search/Filter-splunk-results-into-a-List/m-p/575185#M200423
- Mark as New
- Bookmark Message
- Subscribe to Message
- Mute Message
- Subscribe to RSS Feed
- Permalink
- Report Inappropriate Content
Just change "
stats last(Time) With
stats list(Time) - Mark as New
- Bookmark Message
- Subscribe to Message
- Mute Message
- Subscribe to RSS Feed
- Permalink
- Report Inappropriate Content
- Mark as New
- Bookmark Message
- Subscribe to Message
- Mute Message
- Subscribe to RSS Feed
- Permalink
- Report Inappropriate Content
Perfect!
Thanks a lot @somesoni2
- Mark as New
- Bookmark Message
- Subscribe to Message
- Mute Message
- Subscribe to RSS Feed
- Permalink
- Report Inappropriate Content
@somesoni2 I did as suggested. The error is gone but no results are showing up.
I ran the base query:
index=rac_sd "ERROR * ---" "taskExecutor-*" | table msg
And the results show up.
But when I'm using your query, no results are showing up.
- Mark as New
- Bookmark Message
- Subscribe to Message
- Mute Message
- Subscribe to RSS Feed
- Permalink
- Report Inappropriate Content
This query works
index=rac_sd "ERROR * ---" "taskExecutor-*"
|  rex field=msg "^(?<Time>\S+\s+\S+)\s+\S+\s+(?<Error_Code>\d+)[^\]]+\]\s+(?<Service_Name>\S+)\s+:\s+(?<Error_Message>.+)"
| table Error_Message Time Error_Code Service_Name
| eventstats count as Count by Error_Message Error_Code Service_Name
| sort -Count
Thanks @somesoni2
- Mark as New
- Bookmark Message
- Subscribe to Message
- Mute Message
- Subscribe to RSS Feed
- Permalink
- Report Inappropriate Content
Give this a try
Your base search
| rex “^(?<Time>\S+\s+\S+)\s+\S+\s+(?<Error_Code>\d+)[^\]]+\]\s+(?<Service_Name>\S+)\:\s+(?<Error_Message>.+)”
| table Error_Message Time Error_Code Service_Name
| eventstats count as Count by Error_Message Error_Code Service_Name- Mark as New
- Bookmark Message
- Subscribe to Message
- Mute Message
- Subscribe to RSS Feed
- Permalink
- Report Inappropriate Content
Introducing the Splunk Community Dashboard Challenge!
Get the T-shirt to Prove You Survived Splunk University Bootcamp
Wondering How to Build Resiliency in the Cloud?
