
Join the Conversation
- Find Answers
- :
- Using Splunk
- :
- Splunk Search
- :
- Re: Chart overlay graphs not in sync
- Subscribe to RSS Feed
- Mark Topic as New
- Mark Topic as Read
- Float this Topic for Current User
- Bookmark Topic
- Subscribe to Topic
- Mute Topic
- Printer Friendly Page
- Mark as New
- Bookmark Message
- Subscribe to Message
- Mute Message
- Subscribe to RSS Feed
- Permalink
- Report Inappropriate Content
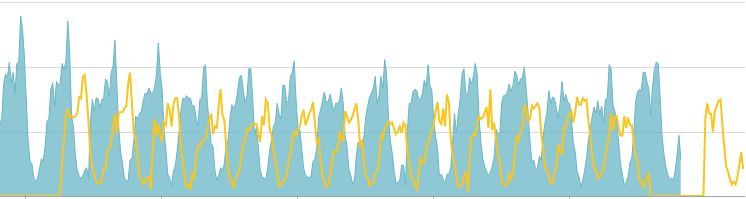
Chart overlay graphs not in sync


- Mark as New
- Bookmark Message
- Subscribe to Message
- Mute Message
- Subscribe to RSS Feed
- Permalink
- Report Inappropriate Content
Hi Norling80
Just copy and test this dashboard xml code
<dashboard>
  <label>dashboard_name</label>
  <row>
    <panel>
      <chart>
        <search>
          <query>index=main sourcetype="playerdata" | timechart span=1h dc(PlayerId) | appendcols [search index=main sourcetype="playerdata" ActionTaken=observe | timechart span=1h dc(PlayerId)]</query>
        </search>
        <option name="charting.axisLabelsX.majorLabelStyle.overflowMode">ellipsisNone</option>
        <option name="charting.axisLabelsX.majorLabelStyle.rotation">0</option>
        <option name="charting.axisTitleX.visibility">visible</option>
        <option name="charting.axisTitleY.visibility">visible</option>
        <option name="charting.axisTitleY2.visibility">visible</option>
        <option name="charting.axisX.scale">linear</option>
        <option name="charting.axisY.scale">linear</option>
        <option name="charting.axisY2.enabled">true</option>
        <option name="charting.axisY2.scale">inherit</option>
        <option name="charting.chart">area</option>
        <option name="charting.chart.bubbleMaximumSize">50</option>
        <option name="charting.chart.bubbleMinimumSize">10</option>
        <option name="charting.chart.bubbleSizeBy">area</option>
        <option name="charting.chart.nullValueMode">gaps</option>
        <option name="charting.chart.sliceCollapsingThreshold">0.01</option>
        <option name="charting.chart.stackMode">default</option>
        <option name="charting.chart.style">shiny</option>
        <option name="charting.drilldown">all</option>
        <option name="charting.layout.splitSeries">0</option>
        <option name="charting.legend.labelStyle.overflowMode">ellipsisMiddle</option>
        <option name="charting.legend.placement">right</option>
        <option name="charting.chart.overlayFields">dc_with_all_ActionTaken</option>
        <option name="charting.axisTitleY.text">dc_with_one_ActionTaken</option>
      </chart>
    </panel>
  </row>
</dashboard>
- Mark as New
- Bookmark Message
- Subscribe to Message
- Mute Message
- Subscribe to RSS Feed
- Permalink
- Report Inappropriate Content
It is possible that when you are running the search for longer duration, values for some rows in one of the searches is null which is resulting in gap.
try to include fillnull at the end of both searches and run again.
index=main sourcetype="playerdata" | timechart span=1h dc(PlayerId) |fillnull value=0 | appendcols [search index=main sourcetype="playerdata" ActionTaken=observe | timechart span=1h dc(PlayerId)|fillnull value=0 ]
- Mark as New
- Bookmark Message
- Subscribe to Message
- Mute Message
- Subscribe to RSS Feed
- Permalink
- Report Inappropriate Content
I still have the same problem, at this point it seems to be a problem with the timestamp, I will look into it and update this thread.
- Mark as New
- Bookmark Message
- Subscribe to Message
- Mute Message
- Subscribe to RSS Feed
- Permalink
- Report Inappropriate Content
Have you got an example of the search or data?
- Mark as New
- Bookmark Message
- Subscribe to Message
- Mute Message
- Subscribe to RSS Feed
- Permalink
- Report Inappropriate Content
Here you go
index=main sourcetype="playerdata" | timechart span=1h dc(PlayerId) | appendcols [search index=main sourcetype="playerdata" ActionTaken=observe | timechart span=1h dc(PlayerId)]
- Mark as New
- Bookmark Message
- Subscribe to Message
- Mute Message
- Subscribe to RSS Feed
- Permalink
- Report Inappropriate Content
Hi,
Could you please have a look into the table which generated this graph?
Check whether the values are in sync??

Join the Splunk Community Slack to learn, troubleshoot, and make connections with fellow Splunk practitioners in real time!
Join Splunk User Groups to connect and learn in-person by region or remotely by topic or industry.
Splunk Add-on for Microsoft Windows 11.0.3: Parse Once, Search Faster
What's New in Splunk Enterprise Security 8.8 and Beyond
A Four-Part Event Series: State of Observability - Where AI Meets Performance
