
Turn on suggestions
Auto-suggest helps you quickly narrow down your search results by suggesting possible matches as you type.
Splunk Search
×
Join the Conversation
Without signing in, you're just watching from the sidelines. Sign in or Register to connect, share, and be part of the Splunk Community.
- Find Answers
- :
- Using Splunk
- :
- Splunk Search
- :
- Re: Change graphics in XML
Options
- Subscribe to RSS Feed
- Mark Topic as New
- Mark Topic as Read
- Float this Topic for Current User
- Bookmark Topic
- Subscribe to Topic
- Mute Topic
- Printer Friendly Page
- Mark as New
- Bookmark Message
- Subscribe to Message
- Mute Message
- Subscribe to RSS Feed
- Permalink
- Report Inappropriate Content
Change graphics in XML

leandromatperei
Path Finder
11-29-2019
04:59 PM
Hello,
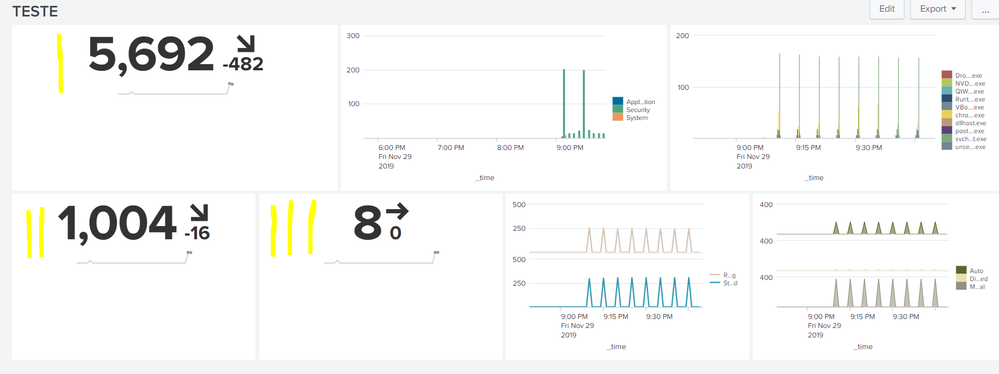
I have the splunk chart structure and would like to leave the 03 charts that are of numbers together within the same square, how can i do this in xml?
I need the first column to have the 03 number charts, one below the other, with reduced sizes.
- Mark as New
- Bookmark Message
- Subscribe to Message
- Mute Message
- Subscribe to RSS Feed
- Permalink
- Report Inappropriate Content

niketn
Legend
12-01-2019
08:13 AM
@leandromatpereira try the Splunk Dashboard App (Beta) which gives your a free from canvas kind of layout to drag, drop and resize viz as per your needs.
PS: Do read about the app as it uses JSON layout instead of Simple XML. https://docs.splunk.com/Documentation/DashApp/latest/DashApp/IntroApp
____________________________________________
| makeresults | eval message= "Happy Splunking!!!"
| makeresults | eval message= "Happy Splunking!!!"
- Mark as New
- Bookmark Message
- Subscribe to Message
- Mute Message
- Subscribe to RSS Feed
- Permalink
- Report Inappropriate Content

to4kawa
Ultra Champion
11-29-2019
08:34 PM
<form hideTitle="false">
    <label>test</label>
    <init>
      <set token="showtab1">first</set>
    </init>
    <fieldset submitButton="true">
      <input type="time" token="field1">
        <label></label>
        <default>
          <earliest>-1h@h</earliest>
          <latest>now</latest>
        </default>
      </input>
    </fieldset>
 <row>
   <panel>
     <html>
          <style>
             .dashboard-header {
                 margin-bottom: 0px;
                 padding-top: 0px;
                 min-height: 0px;
             }
             .myTitle{
                font-size:150%;
                font-weight:bold;
                color:red;
                text-align:center;
             }
          </style>
          <div class="myTitle">My Custom Title</div>
     </html>
   </panel>
 </row>
    <row>
      <panel id="singleValuePanel">
        <title>ALTITUDE</title>
        <html depends="$hiddenForCSS$">
            <style>
              #singleValuePanel{
                width: 15% !important;
              }
              #chartPanel{
                width: 28% !important;
               }
              #chartPanel2{
                width: 28% !important;
               }

              #chartPanel3{
                width: 28% !important;
               }
               #singleValuePanel h3 {
         text-align: center !important;
         }
            </style>
          </html>
        <single>
          <title>CV</title>
          <search>
            <query>| makeresults
   | eval count = random() % 50</query>
            <earliest>$field1.earliest$</earliest>
            <latest>$field1.latest$</latest>
          </search>
          <option name="colorMode">block</option>
          <option name="drilldown">none</option>
          <option name="height">93</option>
          <option name="rangeColors">["0x53a051","0xdc4e41"]</option>
          <option name="rangeValues">[0]</option>
          <option name="refresh.display">progressbar</option>
          <option name="useColors">1</option>
        </single>
        <html>
         </html>
        <single>
          <title>PJ</title>
          <search>
            <query>| makeresults
   | eval count = random() % 50</query>
            <earliest>$field1.earliest$</earliest>
            <latest>$field1.latest$</latest>
          </search>
          <option name="colorMode">block</option>
          <option name="drilldown">none</option>
          <option name="rangeColors">["0x53a051","0xf8be34","0xf1813f","0xdc4e41"]</option>
          <option name="rangeValues">[0,70,100]</option>
          <option name="refresh.display">progressbar</option>
          <option name="useColors">1</option>
        </single>
        <html>
         </html>
        <single>
          <title>PF</title>
          <search>
            <query>| makeresults
   | eval count = random() % 50</query>
            <earliest>$field1.earliest$</earliest>
            <latest>$field1.latest$</latest>
          </search>
          <option name="colorMode">block</option>
          <option name="drilldown">none</option>
          <option name="rangeColors">["0x53a051","0xf8be34","0xf1813f","0xdc4e41"]</option>
          <option name="rangeValues">[0,70,100]</option>
          <option name="refresh.display">progressbar</option>
          <option name="useColors">1</option>
        </single>
      </panel>
      <panel id="chartPanel">
        <title>EMAIL SERVER</title>
        <chart>
          <title>chart 1</title>
          <search>
            <query>index=* | timechart count by usenull=f LogName</query>
            <earliest>$field1.earliest$</earliest>
            <latest>$field1.latest$</latest>
          </search>
          <option name="charting.chart">column</option>
          <option name="charting.drilldown">none</option>
          <option name="charting.legend.placement">bottom</option>
          <option name="refresh.display">progressbar</option>
        </chart>
        <chart>
          <title>chart 2</title>
          <search>
            <query>| makeresults count=2 | streamstats count | eval _time=if((count == 2),relative_time('_time',"-12h"),relative_time('_time',"-5s")) | makecontinuous span=1m | eval count=(random() % 2)</query>
            <earliest>$field1.earliest$</earliest>
            <latest>$field1.latest$</latest>
          </search>
          <option name="charting.chart">line</option>
          <option name="charting.drilldown">none</option>
          <option name="refresh.display">progressbar</option>
        </chart>
      </panel>
      <panel id="chartPanel2">
        <title>CHAT SERVER</title>
        <chart>
          <title>chart 2</title>
          <search>
            <query>index=* | timechart count by usenull=f useother=f Name</query>
            <earliest>$field1.earliest$</earliest>
            <latest>$field1.latest$</latest>
          </search>
          <option name="charting.chart">area</option>
          <option name="charting.drilldown">none</option>
          <option name="charting.legend.placement">bottom</option>
          <option name="refresh.display">progressbar</option>
        </chart>
        <chart>
          <title>chart 2</title>
          <search>
            <query>| makeresults count=2 | streamstats count | eval _time=if((count == 2),relative_time('_time',"-12h"),relative_time('_time',"-5s")) | makecontinuous span=1m | eval count=(random() % 2)</query>
            <earliest>$field1.earliest$</earliest>
            <latest>$field1.latest$</latest>
          </search>
          <option name="charting.chart">line</option>
          <option name="charting.drilldown">none</option>
          <option name="refresh.display">progressbar</option>
        </chart>
      </panel>
      <panel id="chartPanel3">
        <title>IXN</title>
        <chart>
          <title>chart 3</title>
          <search>
            <query>index=* | timechart count by usenull=f useother=f State</query>
            <earliest>$field1.earliest$</earliest>
            <latest>$field1.latest$</latest>
          </search>
          <option name="charting.chart">line</option>
          <option name="charting.drilldown">none</option>
          <option name="refresh.display">progressbar</option>
        </chart>
        <chart>
          <title>chart 2</title>
          <search>
            <query>| makeresults count=2 | streamstats count | eval _time=if((count == 2),relative_time('_time',"-12h"),relative_time('_time',"-5s")) | makecontinuous span=1m | eval count=(random() % 2)</query>
            <earliest>$field1.earliest$</earliest>
            <latest>$field1.latest$</latest>
          </search>
          <option name="charting.chart">line</option>
          <option name="charting.drilldown">none</option>
          <option name="refresh.display">progressbar</option>
        </chart>
      </panel>
    </row>
  </form>
My answer amended.
Finally, <form hideTitle="true">
- Mark as New
- Bookmark Message
- Subscribe to Message
- Mute Message
- Subscribe to RSS Feed
- Permalink
- Report Inappropriate Content
leandromatperei
Path Finder
11-30-2019
04:20 AM
Hi.
And how do I get titles centered?
For example, cv, pj and pf?
- Mark as New
- Bookmark Message
- Subscribe to Message
- Mute Message
- Subscribe to RSS Feed
- Permalink
- Report Inappropriate Content
leandromatperei
Path Finder
11-30-2019
04:21 AM
<form>
<label>test</label>
<init>
<set token="showtab1">first</set>
</init>
<fieldset submitButton="true">
<input type="time" token="field1">
<label></label>
<default>
<earliest>-1h@h</earliest>
<latest>now</latest>
</default>
</input>
</fieldset>
<row>
<panel id="singleValuePanel">
<title>ALTITUDE</title>
<html depends="$hiddenForCSS$">
<style>
#singleValuePanel{
width: 15% !important;
}
#chartPanel{
width: 28% !important;
}
#chartPanel2{
width: 28% !important;
}
#chartPanel3{
width: 28% !important;
}
</style>
</html>
<single>
<title>CV</title>
<search>
<query>| makeresults
| eval count = random() % 50</query>
<earliest>$field1.earliest$</earliest>
<latest>$field1.latest$</latest>
</search>
<option name="colorMode">block</option>
<option name="drilldown">none</option>
<option name="height">93</option>
<option name="rangeColors">["0x53a051","0xdc4e41"]</option>
<option name="rangeValues">[0]</option>
<option name="refresh.display">progressbar</option>
<option name="useColors">1</option>
</single>
<html>
<br/>
</html>
<single>
<title>PJ</title>
<search>
<query>| makeresults
| eval count = random() % 50</query>
<earliest>$field1.earliest$</earliest>
<latest>$field1.latest$</latest>
</search>
<option name="colorMode">block</option>
<option name="drilldown">none</option>
<option name="rangeColors">["0x53a051","0xf8be34","0xf1813f","0xdc4e41"]</option>
<option name="rangeValues">[0,70,100]</option>
<option name="refresh.display">progressbar</option>
<option name="useColors">1</option>
</single>
<html>
<br/>
</html>
<single>
<title>PF</title>
<search>
<query>| makeresults
| eval count = random() % 50</query>
<earliest>$field1.earliest$</earliest>
<latest>$field1.latest$</latest>
</search>
<option name="colorMode">block</option>
<option name="drilldown">none</option>
<option name="rangeColors">["0x53a051","0xf8be34","0xf1813f","0xdc4e41"]</option>
<option name="rangeValues">[0,70,100]</option>
<option name="refresh.display">progressbar</option>
<option name="useColors">1</option>
</single>
</panel>
<panel id="chartPanel">
<title>EMAIL SERVER</title>
<chart>
<title>chart 1</title>
<search>
<query>index=* | timechart count by usenull=f LogName</query>
<earliest>$field1.earliest$</earliest>
<latest>$field1.latest$</latest>
</search>
<option name="charting.chart">column</option>
<option name="charting.drilldown">none</option>
<option name="charting.legend.placement">bottom</option>
<option name="refresh.display">progressbar</option>
</chart>
<chart>
<title>chart 2</title>
<search>
<query>| makeresults count=2 | streamstats count | eval _time=if((count == 2),relative_time('_time',"-12h"),relative_time('_time',"-5s")) | makecontinuous span=1m | eval count=(random() % 2)</query>
<earliest>$field1.earliest$</earliest>
<latest>$field1.latest$</latest>
</search>
<option name="charting.chart">line</option>
<option name="charting.drilldown">none</option>
<option name="refresh.display">progressbar</option>
</chart>
</panel>
<panel id="chartPanel2">
<title>CHAT SERVER</title>
<chart>
<title>chart 2</title>
<search>
<query>index=* | timechart count by usenull=f useother=f Name</query>
<earliest>$field1.earliest$</earliest>
<latest>$field1.latest$</latest>
</search>
<option name="charting.chart">area</option>
<option name="charting.drilldown">none</option>
<option name="charting.legend.placement">bottom</option>
<option name="refresh.display">progressbar</option>
</chart>
<chart>
<title>chart 2</title>
<search>
<query>| makeresults count=2 | streamstats count | eval _time=if((count == 2),relative_time('_time',"-12h"),relative_time('_time',"-5s")) | makecontinuous span=1m | eval count=(random() % 2)</query>
<earliest>$field1.earliest$</earliest>
<latest>$field1.latest$</latest>
</search>
<option name="charting.chart">line</option>
<option name="charting.drilldown">none</option>
<option name="refresh.display">progressbar</option>
</chart>
</panel>
<panel id="chartPanel3">
<title>IXN</title>
<chart>
<title>chart 3</title>
<search>
<query>index=* | timechart count by usenull=f useother=f State</query>
<earliest>$field1.earliest$</earliest>
<latest>$field1.latest$</latest>
</search>
<option name="charting.chart">line</option>
<option name="charting.drilldown">none</option>
<option name="refresh.display">progressbar</option>
</chart>
<chart>
<title>chart 2</title>
<search>
<query>| makeresults count=2 | streamstats count | eval _time=if((count == 2),relative_time('_time',"-12h"),relative_time('_time',"-5s")) | makecontinuous span=1m | eval count=(random() % 2)</query>
<earliest>$field1.earliest$</earliest>
<latest>$field1.latest$</latest>
</search>
<option name="charting.chart">line</option>
<option name="charting.drilldown">none</option>
<option name="refresh.display">progressbar</option>
</chart>
</panel>
</row>
</form>
- Mark as New
- Bookmark Message
- Subscribe to Message
- Mute Message
- Subscribe to RSS Feed
- Permalink
- Report Inappropriate Content
to4kawa
Ultra Champion
11-30-2019
03:27 PM
The answer has been corrected. please confirm.



Got questions? Get answers!
Join the Splunk Community Slack to learn, troubleshoot, and make connections with fellow Splunk practitioners in real time!
Meet up IRL or virtually!
Join Splunk User Groups to connect and learn in-person by region or remotely by topic or industry.
Get Updates on the Splunk Community!
Meet Splunk Observability Studio: AI-Assisted OpenTelemetry Instrumentation Without ...
Instrumentation is usually the last step or even an afterthought when building out a project. The feature ...
Federated Search for Cisco Security and Analytics Logging (SAL) is now GA on Splunk ...
Federated Search for Cisco Security Analytics and Logging (SAL) is now generally available as part of the ...
Your Path to AgenticOps: AI Experiences for Every Splunk Practitioner
Your Path to AgenticOps: AI Experiences for Every Splunk Practitioner
Join us for a demo-driven look at how ...
