
Join the Conversation
- Find Answers
- :
- Using Splunk
- :
- Splunk Search
- :
- Re: Calculating throughput
- Subscribe to RSS Feed
- Mark Topic as New
- Mark Topic as Read
- Float this Topic for Current User
- Bookmark Topic
- Subscribe to Topic
- Mute Topic
- Printer Friendly Page
- Mark as New
- Bookmark Message
- Subscribe to Message
- Mute Message
- Subscribe to RSS Feed
- Permalink
- Report Inappropriate Content
Calculating throughput

In splunk logs, I have to monitor some specific events. The identifier I use to target for those events is a text 'EVENT_PROCESSED'. So my search query is:
index=testIndex namespace=testNameSpace host=\*testHost* log=\*EVENT_PROCESSED*
It fetches me ll of my target events. Please note that EVENT_PROCESSED is not an extracted field and is just a text in the event logs.
Now my aim is to find throughput for these events. So I do this:
index=testIndex namespace=testNameSpace host=\*testHost* log=\*EVENT_PROCESSED* | timechart span=1s count as throughtput
Is this correct way of determining throughput rate? If I change span to some other value, say 1h, then I change to:
index=testIndex namespace=testNameSpace host=\*testHost* log=\*EVENT_PROCESSED* | timechart span=1h count/3600 as throughtput
Is this correct way?
- Mark as New
- Bookmark Message
- Subscribe to Message
- Mute Message
- Subscribe to RSS Feed
- Permalink
- Report Inappropriate Content
When you use your first query, you need to say throughput in "per sec" unit. With span=1h, you can still use "count" only say throughput in "Per hour" unit. If you still want to calculation then store count into another variable like | eventstats count as "Totalcount" then do calculation using eval
- Mark as New
- Bookmark Message
- Subscribe to Message
- Mute Message
- Subscribe to RSS Feed
- Permalink
- Report Inappropriate Content
index=testIndex namespace=testNameSpace host=\*testHost* log=\*EVENT_PROCESSED* | eventstats count as "TotalCount" | eval throughput=TotalCount/3600 | timechart span=1h values(throughput)
Your query might look like this.
- Mark as New
- Bookmark Message
- Subscribe to Message
- Mute Message
- Subscribe to RSS Feed
- Permalink
- Report Inappropriate Content
This displays graphs with dots, even for line chart while Line chart is expected to show continuous curves.
- Mark as New
- Bookmark Message
- Subscribe to Message
- Mute Message
- Subscribe to RSS Feed
- Permalink
- Report Inappropriate Content
- Mark as New
- Bookmark Message
- Subscribe to Message
- Mute Message
- Subscribe to RSS Feed
- Permalink
- Report Inappropriate Content
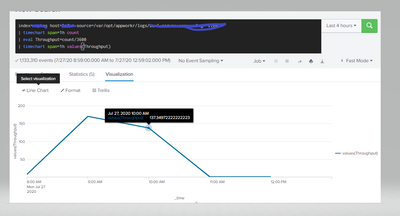
This works perfectly for your requirement.
index=abc host=* source=/var/opt/appworkr/logs/logname "item"
| timechart span=1h count
| eval Throughput=round(count/3600,0)
| timechart span=1h values(Throughput)

Join the Splunk Community Slack to learn, troubleshoot, and make connections with fellow Splunk practitioners in real time!
Join Splunk User Groups to connect and learn in-person by region or remotely by topic or industry.
Make Your Machine Data AI-Ready in Splunk
Splunk Asynchronous Forwarding Explained
How to Monitor AI Agents with Splunk Agent Observability
