Are you a member of the Splunk Community?
- Find Answers
- :
- Using Splunk
- :
- Splunk Search
- :
- Re: Calculate Ratio of Two Counter Streams
- Subscribe to RSS Feed
- Mark Topic as New
- Mark Topic as Read
- Float this Topic for Current User
- Bookmark Topic
- Subscribe to Topic
- Mute Topic
- Printer Friendly Page
- Mark as New
- Bookmark Message
- Subscribe to Message
- Mute Message
- Subscribe to RSS Feed
- Permalink
- Report Inappropriate Content
Calculate Ratio of Two Counter Streams
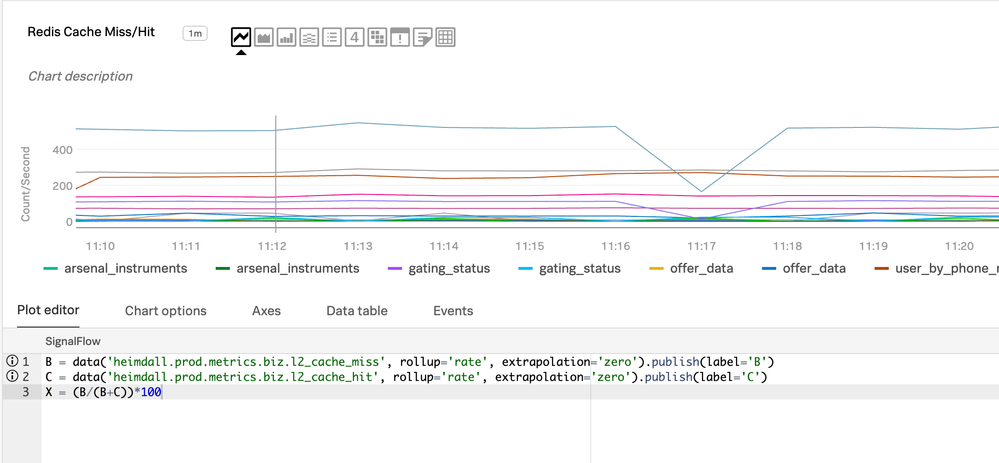
I've two counter streams, I would like to display that as a percentage as
B/(B+C) in the chart but it always gives me an error.
B = data('prod.metrics.biz.l2_cache_miss', rollup='rate', extrapolation='zero').publish(label='B')
C = data('prod.metrics.biz.l2_cache_hit', rollup='rate', extrapolation='zero').publish(label='C')
How can I create a new metrics out of these two to find either cache hit or miss percentage?
- Mark as New
- Bookmark Message
- Subscribe to Message
- Mute Message
- Subscribe to RSS Feed
- Permalink
- Report Inappropriate Content
Hi @sks if you want just the percentage of misses and the percentage of hits, you can do this with eval:
| eval Bperc=('B'/(B+C))*100
| eval Cperc=('C'/(B+C))*100
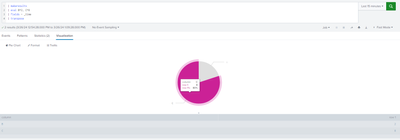
If you want to show this in a chart (e.g. pie chart) you don't need to calculate the percentage as Splunk will do this for you, but you will need to get the values of B and C in the same column using transpose. Example:
- Mark as New
- Bookmark Message
- Subscribe to Message
- Mute Message
- Subscribe to RSS Feed
- Permalink
- Report Inappropriate Content
Hi @KendallW
Thanks for the reply, but that does not work as I'm plotting this in the line chart. The data is coming to SignalFx from the StatsD agent.


