
Join the Conversation
- Find Answers
- :
- Using Splunk
- :
- Splunk Search
- :
- Re: Aggregate query help
- Subscribe to RSS Feed
- Mark Topic as New
- Mark Topic as Read
- Float this Topic for Current User
- Bookmark Topic
- Subscribe to Topic
- Mute Topic
- Printer Friendly Page
- Mark as New
- Bookmark Message
- Subscribe to Message
- Mute Message
- Subscribe to RSS Feed
- Permalink
- Report Inappropriate Content

Hi Team - I am trying to first search and then aggregate results from following Splunk logs:
Raw format:
"buildDimensionsAttributes: $attribute: $constraint: $result"
sample message:
message: buildDimensionsAttributes: 6393: AttributeConstraints(-1.0,99.92,2,DoubleFormat): 99.98Here in the AttributeConstraints
1st index corresponds to minval here -1.0
2nd index corresponds to maxval here 99.92
3rd index corresponds to decimal here 2
I want to first filter $results which are out of range, here 99.98 is not between [-1.0 , 99.92] and then
aggregate (group by) various $attribute and then
showcase something like below on the dashboard where we can apply our usual time filters.
Attribute# | RecrdCountofOutofRange | TotalRecords
Thanks
AG
- Mark as New
- Bookmark Message
- Subscribe to Message
- Mute Message
- Subscribe to RSS Feed
- Permalink
- Report Inappropriate Content


Hi @aag
See if this helps!.
<your_Search_goes_here>
| rex "buildDimensionsAttributes:\s+(?<attr>\d+):\s+AttributeConstraints\((?<idx1>.+?),(?<idx2>.+?),(?<idx3>.+?),.+?\):\s+(?<number>[\d\.]+)"
| stats count as total, count(eval(number < idx1 OR number > idx2 )) as RecordOutRange by attr
---
An upvote would be appreciated if this reply helps and Accept solution!
- Mark as New
- Bookmark Message
- Subscribe to Message
- Mute Message
- Subscribe to RSS Feed
- Permalink
- Report Inappropriate Content
Hi @aag
See if this helps!.
<your_Search_goes_here>
| rex "buildDimensionsAttributes:\s+(?<attr>\d+):\s+AttributeConstraints\((?<idx1>.+?),(?<idx2>.+?),(?<idx3>.+?),.+?\):\s+(?<number>[\d\.]+)"
| stats count as total, count(eval(number < idx1 OR number > idx2 )) as RecordOutRange by attr
---
An upvote would be appreciated if this reply helps and Accept solution!
- Mark as New
- Bookmark Message
- Subscribe to Message
- Mute Message
- Subscribe to RSS Feed
- Permalink
- Report Inappropriate Content
Thanks much @venkatasri ; it worked beautifully !
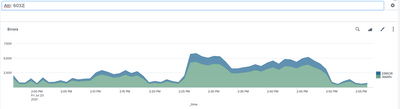
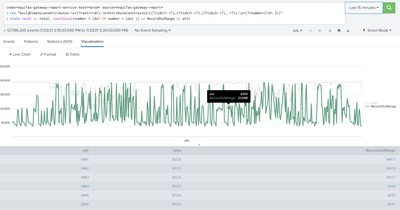
As a next step would like to showcase the result on dashboard, where from a drop down when we select a particular attribute it will show the count of total and RecordOutRange on y-axis in time span of every15min on x-axis. Something like below:
Helpful image from query showcasing all attributes in same graph:
Thanks

Join the Splunk Community Slack to learn, troubleshoot, and make connections with fellow Splunk practitioners in real time!
Join Splunk User Groups to connect and learn in-person by region or remotely by topic or industry.
Manage Edge Processor pipelines end to end with APIs
Splunk Brings Proof of Control to Digital Asset Transfers
Manage Ingest Processor pipelines end to end with APIs
