- Mark as New
- Bookmark Message
- Subscribe to Message
- Mute Message
- Subscribe to RSS Feed
- Permalink
- Report Inappropriate Content
A field is lost in a message sent in raw?
Good afternoon!
I send a message like this:
curl --location --request POST 'http://test.test.org:8088/services/collector/raw' --header 'Authorization: Splunk 0202-0404-4949-9c-27' --header 'Content-Type: text/plain' --data-raw '{
"messageId": "ED280816-E404-444A-A2D9-FFD2D171F323",
"messageType": "RABIS-HeartBeat",
"eventTime": "2022-10-13T18:08:00",
}'
The message arrives in splunk, but I don't see the field: "eventTime": "2022-10-13T18:08:00"
I have shown an example in the screenshot.
Please let me know which time format I need to use.
- Mark as New
- Bookmark Message
- Subscribe to Message
- Mute Message
- Subscribe to RSS Feed
- Permalink
- Report Inappropriate Content
Try removing the comma from the end of the eventTime line
- Mark as New
- Bookmark Message
- Subscribe to Message
- Mute Message
- Subscribe to RSS Feed
- Permalink
- Report Inappropriate Content
Yesterday I tested a lot and realized that this message format works every other time:
curl --location --request POST 'http://10.10.10.10:8088/services/collector/raw' --header 'Authorization: Splunk a2-a2-a2' --header 'Content-Type: text/plain' --data-raw '{
"messageId": "ED280816-E404-444A-A2D9-FFD2D171F111",
"messageType": "RABIS-HeartBeat",
"eventTime": "1985-04-12T23:21:15"
}'
I just saw that the correct messages have 23 spaces, the problematic ones have 22. Not the point, I just copy the correct messages - for the test, we can assume that I figured it out.
The problem remains with messages where the field is: "eventTime": "1985-04-12T23:21:15" in the middle. I have no guarantee that it will be different in production.
Here is an example:
curl --location --request POST 'http://10.10.10.10:8088/services/collector/raw' --header 'Authorization: Splunk a24-a24-a24-a24' --header 'Content-Type: text/plain' --data-raw '{
"messageId": "ED280816-E404-444A-A2D9-FFD2D171F136",
"eventTime": "2022-11-07T17:06:15",
"messageType": "RABIS-HeartBeat"
}'
In this case, I can't find messages at all in the splank index. Although I can see that it was sent successfully in the bash console.
Splank doesn't like our format(( This is how he likes it: 2022-11-0717:06:15
- Mark as New
- Bookmark Message
- Subscribe to Message
- Mute Message
- Subscribe to RSS Feed
- Permalink
- Report Inappropriate Content
How have you defined the source type you are using for your raw data?
- Mark as New
- Bookmark Message
- Subscribe to Message
- Mute Message
- Subscribe to RSS Feed
- Permalink
- Report Inappropriate Content
I localized this problem, for some reason splunk takes the time from my eventTime field and substitutes it in the _time field, which violates the date the message was received, I see my messages as sent yesterday, I understand that they are, by the messageId field, I put them unique for each test submission.
But I don't understand why this is happening.
- Mark as New
- Bookmark Message
- Subscribe to Message
- Mute Message
- Subscribe to RSS Feed
- Permalink
- Report Inappropriate Content
By default, splunk will try to find a time value to put in the _time field. You should be able to override this on a sourcetype basis, but since you are not specifying a sourcetype, you get the default.
- Mark as New
- Bookmark Message
- Subscribe to Message
- Mute Message
- Subscribe to RSS Feed
- Permalink
- Report Inappropriate Content
I still don't quite understand how I can make it work. Splunk itself gives my messages a sourcetype based on their token. It's just that I don't specify the sourcetype in the request, I made a new request:
index="rs" messageType="RABIS" sourcetype="RS"
| eval timeValue='eventTime'
| eval time=strptime(timeValue,"%Y-%m-%dT%H:%M:%S.%3N%Z")
| sort -_time
| eval timeValue='eventTime'
| eval time=strptime(timeValue,"%Y-%m-%dT%H:%M:%S.%3N%Z")
| eval Time=strftime(_time,"%Y-%m-%dT%H:%M:%S")
| stats list(Time) as Time list(eventTime) as EventTime list(messageType) as MessageType list(messageId) as MessageId by messageType
I see my messages, but also as if they came yesterday and not today, that is, for the past date. Really sourcetype needs to be registered in the message?
- Mark as New
- Bookmark Message
- Subscribe to Message
- Mute Message
- Subscribe to RSS Feed
- Permalink
- Report Inappropriate Content
You are right, the sourcetype can be specified in the token - however, you may need to configure the datetime recognition for that sourcetype so that it doesn't use the datetime it finds in the raw event.
https://docs.splunk.com/Documentation/Splunk/9.0.1/Data/Configuretimestamprecognition
- Mark as New
- Bookmark Message
- Subscribe to Message
- Mute Message
- Subscribe to RSS Feed
- Permalink
- Report Inappropriate Content
I found where this is done, in the settings: Source Types
I follow this recommendation:
lick Timestamps. The list expands to show extraction options. Select from one of the following options:
Current time: Apply the current time to all events detected.
I tried to show it on the screenshot, but it did not help ((
- Mark as New
- Bookmark Message
- Subscribe to Message
- Mute Message
- Subscribe to RSS Feed
- Permalink
- Report Inappropriate Content
Hello, I understand correctly, I need to study this particular article? It:
https://docs.splunk.com/Documentation/Splunk/9.0.1/Data/Setsourcetype
I can't find this button in the interface: Click Event breaks ((
- Mark as New
- Bookmark Message
- Subscribe to Message
- Mute Message
- Subscribe to RSS Feed
- Permalink
- Report Inappropriate Content
That is? How will it help?
All my posts go to one index, I don't use sourcetype. I see that I have a problem with the fact that the field format cannot be parsed by splunk.
- Mark as New
- Bookmark Message
- Subscribe to Message
- Mute Message
- Subscribe to RSS Feed
- Permalink
- Report Inappropriate Content
@metylkinandrey wrote:I localized this problem, for some reason splunk takes the time from my eventTime field and substitutes it in the _time field, which violates the date the message was received, I see my messages
Is it your intention to force Splunk to omit this action? From Timestamp settings (in the reference @ITWhisperer showed):
Set DATETIME_CONFIG = NONE to prevent the timestamp processor from running. When timestamp processing is off, Splunk Enterprise does not look at the text of the event for the timestamp and instead uses the event time of receipt, the time the event arrives through its input. For file-based inputs, the event timestamp is taken from from the modification time of the input file.
Also, I see that you are trying to post conformant JSON. Why use 'Content-Type: text/plain'?
To automatically extract fields, you should set either INDEXED_EXTRACTIONS = JSON or KV_MODE = json.
(See Props.conf attributes for structured data, Automatic key-value field extraction format.) In all cases, you will need to define these parameters in props.conf and, as ITWhisperer hinted, you need to know which sourcetypes to tweak.
- Mark as New
- Bookmark Message
- Subscribe to Message
- Mute Message
- Subscribe to RSS Feed
- Permalink
- Report Inappropriate Content
My current configuration:
[generic_single_line]
DATETIME_CONFIG = NONE
LINE_BREAKER = ([\r\n]+)
NO_BINARY_CHECK = true
TIME_FORMAT =
disabled = false
SHOULD_LINEMERGE = true
- Mark as New
- Bookmark Message
- Subscribe to Message
- Mute Message
- Subscribe to RSS Feed
- Permalink
- Report Inappropriate Content
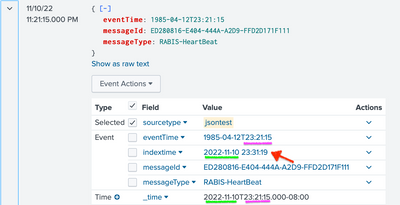
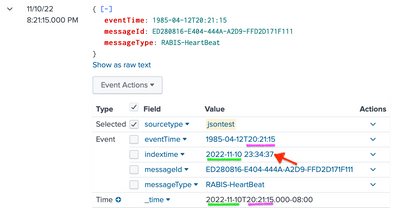
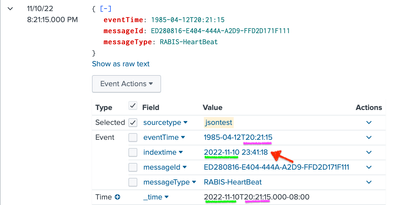
@metylkinandrey You discovered a bug. I used your data as template to conduct a series of tests in my 9.0.2 and got some very surprising results. To nail the strangeness, I added indextime (| rename _indextime as indextime), and shifted eventTime around. Regardless of values of DATETIME_CONFIG (NONE or CURRENT), INDEXED_EXTRACTIONS (NONE or json), and KV_MODE (NONE or json), the outcome is the same:
In my tests, Splunk takes the time of day from eventTime (23:21:15 or 20:21:15) and combine it to the current date (2022-11-10) as _time. No matter how many times, and at what hour I submit the event, as long as it is on the same date, all resultant events have exactly identical _time. If the time of day in eventTime is later than _indextime, (e.g., if eventTime is 1985-04-12T23:21:15 but I am testing around 23:00:00) Splunk cannot even find the event unless search window is set to all time. (Or to set latest to after today+23:21:15.)
| { "messageId": "ED280816-E404-444A-A2D9-FFD2D171F111", "messageType": "RABIS-HeartBeat", "eventTime": "1985-04-12T23:21:15" } | { "messageId": "ED280816-E404-444A-A2D9-FFD2D171F111", "messageType": "RABIS-HeartBeat", "eventTime": "1985-04-12T20:21:15" } |
 |  |
 |
You should file a bug and submit for support. To work around the search problem, you can use | rename _indextime as _time.
- Mark as New
- Bookmark Message
- Subscribe to Message
- Mute Message
- Subscribe to RSS Feed
- Permalink
- Report Inappropriate Content
@yuanliu Do I understand correctly that forum users with the status - SplunkTrust, are also technical support?
- Mark as New
- Bookmark Message
- Subscribe to Message
- Mute Message
- Subscribe to RSS Feed
- Permalink
- Report Inappropriate Content
@metylkinandrey SplunkTrust's don't all work for Splunk; many of them who do are not in support. (You can click SPLUNKTRUST link on the top of this page to find out about SplunktTrust program and its members.) Personally I do not work for Splunk.
- Mark as New
- Bookmark Message
- Subscribe to Message
- Mute Message
- Subscribe to RSS Feed
- Permalink
- Report Inappropriate Content
Tell me, you mean paid technical support? I assume that our clients have some support from splunk, but we should not bother them.) This is a bad idea) In our case, we are not using splunk for ourselves, we are just trying to implement monitoring of the system that we do for clients, on the stands clients. But our difficulties should not concern them.
Or is there some other form of communication with splunk support?
- Mark as New
- Bookmark Message
- Subscribe to Message
- Mute Message
- Subscribe to RSS Feed
- Permalink
- Report Inappropriate Content
Tell me, you mean paid technical support? I assume that our clients have some support from splunk,
I'm not sure which support tier is appropriate but a product defect should concern everyone in Splunk. I do not believe that a bug report is a billable event.
- Mark as New
- Bookmark Message
- Subscribe to Message
- Mute Message
- Subscribe to RSS Feed
- Permalink
- Report Inappropriate Content
I did everything by acting on this recommendation:
Set DATETIME_CONFIG = NONE to prevent the timestamp processor from running. When timestamp processing is off, Splunk Enterprise does not look at the text of the event for the timestamp and instead uses the event time of receipt, the time the event arrives through its input. For file-based inputs, the event timestamp is taken from from the modification time of the input file.
Let me not like this option very much (
After editing the file /opt/splunk/etc/system/local/props.conf
I completely restarted the docker container so that splunk picks up the settings.
And it broke everything for me! Now I can't see my messages even if I set the filter: for the last year (((
While the messages are being sent, I get the code: "Success","code":0
- Mark as New
- Bookmark Message
- Subscribe to Message
- Mute Message
- Subscribe to RSS Feed
- Permalink
- Report Inappropriate Content
I'm experimenting, so far in the file: /opt/splunk/etc/system/local/props.conf set the parameter: DATETIME_CONFIG = NONE
Can you tell me how to apply the new settings in splunk?
- Mark as New
- Bookmark Message
- Subscribe to Message
- Mute Message
- Subscribe to RSS Feed
- Permalink
- Report Inappropriate Content
I also want to ask, is there really no other option to bypass this problem, except to edit the file: props.conf ?
Can you tell me how can I edit this file? If this is the only way out: a way and where to find it, do I need access to the file system?
I'm afraid that editing this file: props.conf
will affect all applications in splunk and other employees will not process their requests correctly. I will not be able to correct the requests of other employees purely physically, since this is our customer. (((
