Join the Conversation
- Find Answers
- :
- Premium Solutions
- :
- Splunk ITSI
- :
- In Splunk IT Service Intelligence, why can I not s...
- Subscribe to RSS Feed
- Mark Topic as New
- Mark Topic as Read
- Float this Topic for Current User
- Bookmark Topic
- Subscribe to Topic
- Mute Topic
- Printer Friendly Page
- Mark as New
- Bookmark Message
- Subscribe to Message
- Mute Message
- Subscribe to RSS Feed
- Permalink
- Report Inappropriate Content
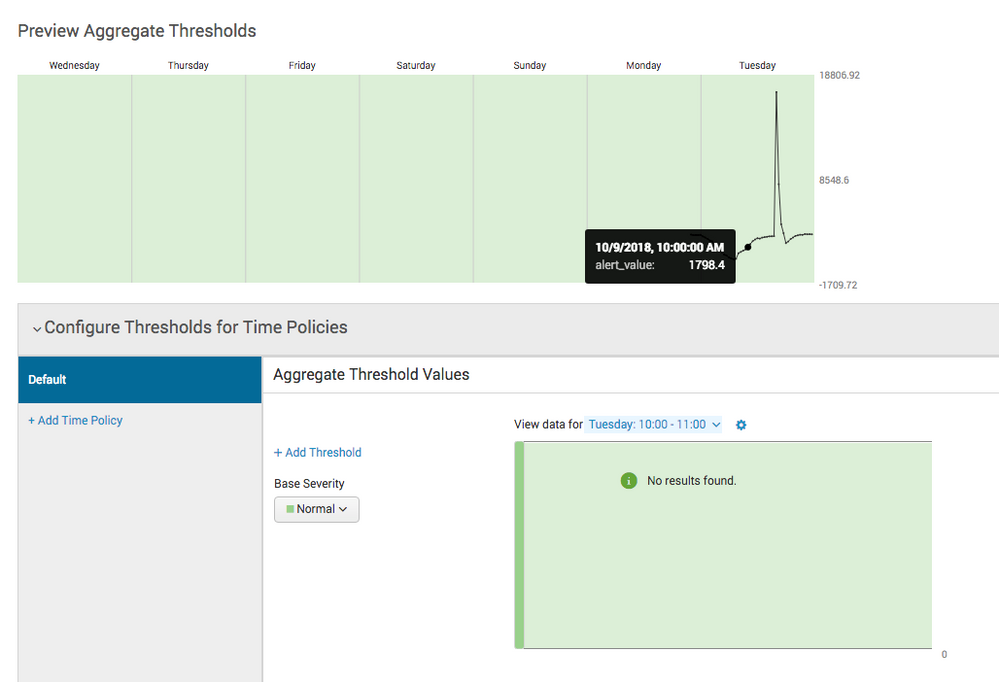
For some reason, when I attempt to preview data in the Aggregate Threshold View window for data that DEFINITELY exists and I can see it in the preview above the Aggregate Threshold View window, it does not show up. See screenshot.
Has anyone else experienced this?
- Mark as New
- Bookmark Message
- Subscribe to Message
- Mute Message
- Subscribe to RSS Feed
- Permalink
- Report Inappropriate Content
Perhaps you could try to create another service, backfill the KPI's and try again? If this still doesn't work, you should open a support case
What version of ITSI are you running?
- Mark as New
- Bookmark Message
- Subscribe to Message
- Mute Message
- Subscribe to RSS Feed
- Permalink
- Report Inappropriate Content
Okay I think I have an idea of what is happening though I dont understand why.
I needed to create kpis that were based on the computation of other kpis so I created these services with a query like:
sourcetype=abc-prod A0010 | stats sum(foo) as FOO sum(bar) as BAR | eval FOOBYSEC = FOO/300
And then I was grabbing KPIs based on the new kpi of FOOBYSEC
(For this query I need the sum of a kpi value for 5 minutes divided by 300 to show average per second, this is the only way I know how to do this)
When I use a query like that, it doesnt seem to allow me to use the preview data in Aggregate Threshold Values preview.
I created a new service with a simple query and now it seems to work. But Im back at square one because I need to show that kpi value for 5 minutes of average per second...
- Mark as New
- Bookmark Message
- Subscribe to Message
- Mute Message
- Subscribe to RSS Feed
- Permalink
- Report Inappropriate Content
So with ITSI, you should not use a reporting command in your search. ITSI will add the reporting command at the end of your search. To fix this, use eventstats like this
sourcetype=abc-prod A0010
| eventstats sum(foo) as FOO sum(bar) as BAR
| eval FOOBYSEC = FOO/300
*You should also add an index to to your search
When you add that stats in your search, it could mess up the backfill. You can quickly check this by looking in the itsi_summary index. Find your kpi name in the itsi_summary then use a timechart to see how far back it goes like this. Run it over 60 days to see how far back it goes
index=itsi_summary kpi="YOUR KPI NAME"
| timechart span=5m count
If it's not backfilling as expected, then thats your issue. If you confirmed the data is backfilled more than a few days then its an ITSI issue
- Mark as New
- Bookmark Message
- Subscribe to Message
- Mute Message
- Subscribe to RSS Feed
- Permalink
- Report Inappropriate Content
Interesting. So eventstats should not prevent the backfill then? I will test this out.
- Mark as New
- Bookmark Message
- Subscribe to Message
- Mute Message
- Subscribe to RSS Feed
- Permalink
- Report Inappropriate Content
Correct. When you use a reporting command stats you are dropping all other fields. When using eventstats you're adding that field and keeping the other fields.
- Mark as New
- Bookmark Message
- Subscribe to Message
- Mute Message
- Subscribe to RSS Feed
- Permalink
- Report Inappropriate Content
Thanks. Using eventstats it did backfill but the results of the numbers are different from when I use stats and I am unsure why. Logically they shouldn't be.
- Mark as New
- Bookmark Message
- Subscribe to Message
- Mute Message
- Subscribe to RSS Feed
- Permalink
- Report Inappropriate Content
Strange you have different results, you can compare the raw data against the itsi_summary index and see what's different. But the important lesson here is to not use a reporting command in your search. If this solved your problem, can you accept it as the answer and upvote?

