Turn on suggestions
Auto-suggest helps you quickly narrow down your search results by suggesting possible matches as you type.
Splunk Enterprise
×
Join the Conversation
Without signing in, you're just watching from the sidelines. Sign in or Register to connect, share, and be part of the Splunk Community.
Turn on suggestions
Auto-suggest helps you quickly narrow down your search results by suggesting possible matches as you type.
- Find Answers
- :
- Splunk Platform
- :
- Splunk Enterprise
- :
- Why is there an Error while loading Alert Manager ...
Options
- Subscribe to RSS Feed
- Mark Topic as New
- Mark Topic as Read
- Float this Topic for Current User
- Bookmark Topic
- Subscribe to Topic
- Mute Topic
- Printer Friendly Page
- Mark as New
- Bookmark Message
- Subscribe to Message
- Mute Message
- Subscribe to RSS Feed
- Permalink
- Report Inappropriate Content
Why is there an Error while loading Alert Manager Settings Dashboard?
Arch
Loves-to-Learn Lots
04-07-2022
05:20 AM
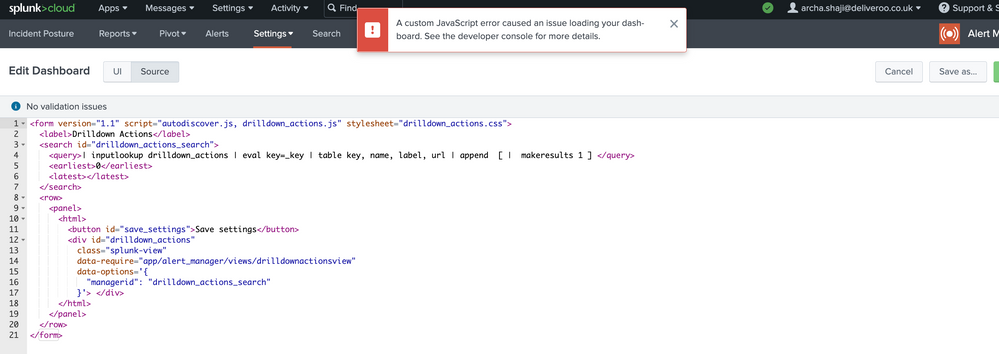
We are using the alert manager app in our environment to add incident workflows to Splunk. After updating our Splunk Cloud to the latest Cloud version, we are facing an error while trying to access the alert manager settings page.
Error: 'A custom JavaScript error caused an issue loading your dashboard. See the developer console for more details.’
We have already reached out to Splunk support to fix this issue. We have tried all the workarounds that they have mentioned to fix the compatibility issue of dashboards that use custom JavaScript with jQuery 3.5 or higher. But it did not help.
It would be great if someone could help me in fixing this issue ..

Get Updates on the Splunk Community!
Splunk MCP & Agentic AI: Machine Data Without Limits
Discover how the Splunk Model Context Protocol (MCP) Server can revolutionize the way your organization ...
Finding Based Detections General Availability
Overview
We’ve come a long way, folks, but here in Enterprise Security 8.4 I’m happy to announce Finding ...
Get Your Hands Dirty (and Your Shoes Comfy): The Splunk Experience
Hands-On Learning and Technical Seminars
Sometimes, you just need to see the code. For those looking for a ...
