- Find Answers
- :
- Splunk Platform
- :
- Splunk Enterprise
- :
- Why is Secure Gateway Status Not Connected?
- Subscribe to RSS Feed
- Mark Topic as New
- Mark Topic as Read
- Float this Topic for Current User
- Bookmark Topic
- Subscribe to Topic
- Mute Topic
- Printer Friendly Page
- Mark as New
- Bookmark Message
- Subscribe to Message
- Mute Message
- Subscribe to RSS Feed
- Permalink
- Report Inappropriate Content
Why is Secure Gateway Status Not Connected?
I had the Splunk Cloud Gateway installed before it was standard (Splunk 7.x) and working, with alerts and dashboards accessible from my phone. I believe during a license update that stripped my account (new terms allows for only one account, so admin) broke it (stopped getting alerts). Since its a home lab and not prod I didn't dig into it.
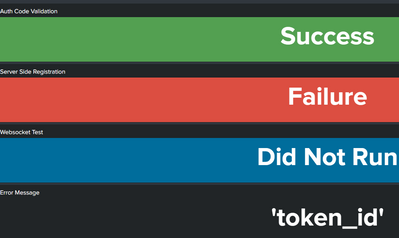
Now that I am digging into it, the gateway dashboard is showing this:
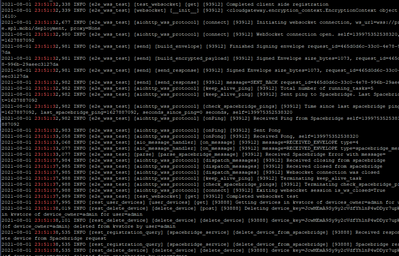
SPL: index=_internal source=*cloud* ERROR AND NOT SUBSCRIPTION
Shows this:
I can register my device, but it can't see any dashboards, it seems to time out.
There seems to be a vacuum in google as to troubleshooting this except talk of using proxies. I am not running a proxy.
What could the issue be?
- Mark as New
- Bookmark Message
- Subscribe to Message
- Mute Message
- Subscribe to RSS Feed
- Permalink
- Report Inappropriate Content
Additional info from one of the troubleshooting dashboards:
- Mark as New
- Bookmark Message
- Subscribe to Message
- Mute Message
- Subscribe to RSS Feed
- Permalink
- Report Inappropriate Content
We are having this same issue on Splunk Enterprise 8.2.6 on prem with Splunk Secure Gateway 2.7.4, according to the firewall rules the connection port 443 outbound to the host prod.spacebridge.spl.mobi is allowed.
When we run the following rest command:
| rest "services/ssg/test_websocket" request_type="{\"versionGetRequest\": {}}" request_mode=clientSingleRequestWe get this output:
auth_code_status = 200
completed_client_registration = 0
error = 'token_id'
server_registration_status = 400
splunk_server = server
wss_response = 0
The error traceback in _internal is:
2022-05-09 11:22:58,148 ERROR [rest_base] [__init__] [exception] [4772] Spacebridge error
Traceback (most recent call last):
  File "/opt/splunk/etc/apps/splunk_secure_gateway/bin/spacebridgeapp/rest/util/helper.py", line 13, in extract_parameter
    result = obj[key]
KeyError: 'self_register'
During handling of the above exception, another exception occurred:
Traceback (most recent call last):
  File "/opt/splunk/etc/apps/splunk_secure_gateway/bin/spacebridgeapp/rest/base_endpoint.py", line 53, in handle
    res = self.handle_request(request)
  File "/opt/splunk/etc/apps/splunk_secure_gateway/bin/spacebridgeapp/rest/base_endpoint.py", line 86, in handle_request
    return self.post(request)
  File "/opt/splunk/etc/apps/splunk_secure_gateway/bin/spacebridgeapp/rest/registration/saml_registration_handler.py", line 70, in post
    self_register = extract_parameter(request['query'], SELF_REGISTER_LABEL, QUERY_LABEL)
  File "/opt/splunk/etc/apps/splunk_secure_gateway/bin/spacebridgeapp/rest/util/helper.py", line 15, in extract_parameter
    raise Errors.SpacebridgeRestError('Error: Request requires %s parameter "%s"' % (source_name, key), 400)
spacebridgeapp.rest.util.errors.SpacebridgeRestError: Error: Request requires query parameter "self_register"
Did you managed to solve this issue?
- Mark as New
- Bookmark Message
- Subscribe to Message
- Mute Message
- Subscribe to RSS Feed
- Permalink
- Report Inappropriate Content
I can delete devices, I can somewhat register a device (error at the end of the process telling me to contact the admin).
Thankfully production doesn't use this, but seems shaky for a built in app.
- Mark as New
- Bookmark Message
- Subscribe to Message
- Mute Message
- Subscribe to RSS Feed
- Permalink
- Report Inappropriate Content
I had to revert my VM from a snapshot back to Splunk 8.0.1 using Splunk Cloud Gateway instead of Secure Gateway. It now works, I can register my device and check dashboards.
- Mark as New
- Bookmark Message
- Subscribe to Message
- Mute Message
- Subscribe to RSS Feed
- Permalink
- Report Inappropriate Content
Did you ever get this resolved using SSG?
I'm having the **exact** same issue with 8.2.x docker in my LAB setup.
- Mark as New
- Bookmark Message
- Subscribe to Message
- Mute Message
- Subscribe to RSS Feed
- Permalink
- Report Inappropriate Content
Never fixed it, I just restored to an older version of Splunk 7 and forgoing the update to 8.


