Join the Conversation
- Find Answers
- :
- Splunk Platform
- :
- Splunk Enterprise
- :
- Unsual behavior with search events
- Subscribe to RSS Feed
- Mark Topic as New
- Mark Topic as Read
- Float this Topic for Current User
- Bookmark Topic
- Subscribe to Topic
- Mute Topic
- Printer Friendly Page
- Mark as New
- Bookmark Message
- Subscribe to Message
- Mute Message
- Subscribe to RSS Feed
- Permalink
- Report Inappropriate Content
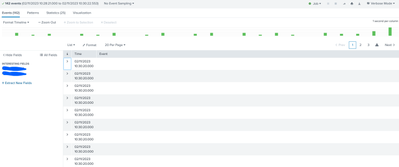
We have recently upgraded to Splunk Enterprise 9.0. When I try to run a search query without adding the index field into it, the event count are showing wrong. Also if I try to see the respective event logs, from Verbose mode they are weird and this is not usual format of logs.
In other case, if index is mentioned in the query, everything is working fine and asusual.
This issue occurs only when the search query have stats or chart commands to visualise the data. Below is the sample search query which I used
host=abc sourcetype=xyz |stats count
I am not sure whether it is a bug in Splunk 9.0 or any other issue from config side (like limitations in search head). Could anyone please help me on this.
- Mark as New
- Bookmark Message
- Subscribe to Message
- Mute Message
- Subscribe to RSS Feed
- Permalink
- Report Inappropriate Content
Hi
Usually you should always add index=xyz on your query to avoid this situation. This is the best practices!
The reason for that behaviour is that every role has attribute srchIndexesDefault which are used if you don't add index=xyz on your query.
srchIndexesDefault = <semicolon-separated list>
* A list of indexes to search when no index is specified.
* These indexes can be wild-carded ("*"), with the exception that "*" does not
  match internal indexes.
* To match internal indexes, start with an underscore ("_"). All internal indexes are
  represented by "_*".
* The wildcard character "*" is limited to match either all the non-internal
  indexes or all the internal indexes, but not both at once.
* No default.
As users usually have different roles they have different combination of srchIndexesDefault and for that reason the real searches gives you to different results.
https://docs.splunk.com/Documentation/Splunk/latest/Admin/Authorizeconf
r. Ismo
- Mark as New
- Bookmark Message
- Subscribe to Message
- Mute Message
- Subscribe to RSS Feed
- Permalink
- Report Inappropriate Content
Could any help or suggest me on this? Why am I getting blank events in the verbose mode when I run the search query without index field?
- Mark as New
- Bookmark Message
- Subscribe to Message
- Mute Message
- Subscribe to RSS Feed
- Permalink
- Report Inappropriate Content
With the same query, if I try to view the events from verbose mode, I get something like blank events. Please. refer the attached screenshot. But this was not occurring earlier. We used to see the respective log events for the host and sourcetype which are mentioned in the query (though index is not included.)
- Mark as New
- Bookmark Message
- Subscribe to Message
- Mute Message
- Subscribe to RSS Feed
- Permalink
- Report Inappropriate Content
Which kind of environment you have (single node, distributed) and have all nodes updated to the same version Splunk + OS and are all nodes using same OS?
- Mark as New
- Bookmark Message
- Subscribe to Message
- Mute Message
- Subscribe to RSS Feed
- Permalink
- Report Inappropriate Content
We have distributed environment. The Splunk version is same. The OS version of indexer, search heads are same but for deployment server it is different.
- Mark as New
- Bookmark Message
- Subscribe to Message
- Mute Message
- Subscribe to RSS Feed
- Permalink
- Report Inappropriate Content
- Mark as New
- Bookmark Message
- Subscribe to Message
- Mute Message
- Subscribe to RSS Feed
- Permalink
- Report Inappropriate Content
Yes I have cross verified and all of the OS versions are supported for the Splunk version 9.0, as mentioned - here
- Mark as New
- Bookmark Message
- Subscribe to Message
- Mute Message
- Subscribe to RSS Feed
- Permalink
- Report Inappropriate Content
Hi
Usually you should always add index=xyz on your query to avoid this situation. This is the best practices!
The reason for that behaviour is that every role has attribute srchIndexesDefault which are used if you don't add index=xyz on your query.
srchIndexesDefault = <semicolon-separated list>
* A list of indexes to search when no index is specified.
* These indexes can be wild-carded ("*"), with the exception that "*" does not
  match internal indexes.
* To match internal indexes, start with an underscore ("_"). All internal indexes are
  represented by "_*".
* The wildcard character "*" is limited to match either all the non-internal
  indexes or all the internal indexes, but not both at once.
* No default.
As users usually have different roles they have different combination of srchIndexesDefault and for that reason the real searches gives you to different results.
https://docs.splunk.com/Documentation/Splunk/latest/Admin/Authorizeconf
r. Ismo
- Mark as New
- Bookmark Message
- Subscribe to Message
- Mute Message
- Subscribe to RSS Feed
- Permalink
- Report Inappropriate Content
If the search indexes are based on roles, then the search query should behave in same way with or without any commands (like statistical command, chart commands or any other functions).
In my case, I am getting the empty logs whenever I run any of the below queries
host=abc sourcetype=xyz |stats count
(or)
host=abc sourcetype=xyz |timechart count
whereas, with the below query (without mentioning index) I am able to see the log events successfully.
host=abc sourcetype=xyz

