- Find Answers
- :
- Splunk Platform
- :
- Splunk Enterprise
- :
- How to list all hosts with their fields?
- Subscribe to RSS Feed
- Mark Topic as New
- Mark Topic as Read
- Float this Topic for Current User
- Bookmark Topic
- Subscribe to Topic
- Mute Topic
- Printer Friendly Page
- Mark as New
- Bookmark Message
- Subscribe to Message
- Mute Message
- Subscribe to RSS Feed
- Permalink
- Report Inappropriate Content
Hi everyone, I want to create an hourly alert that logs the multiple server's CPU usage, queue length, memory usage and disk space used.
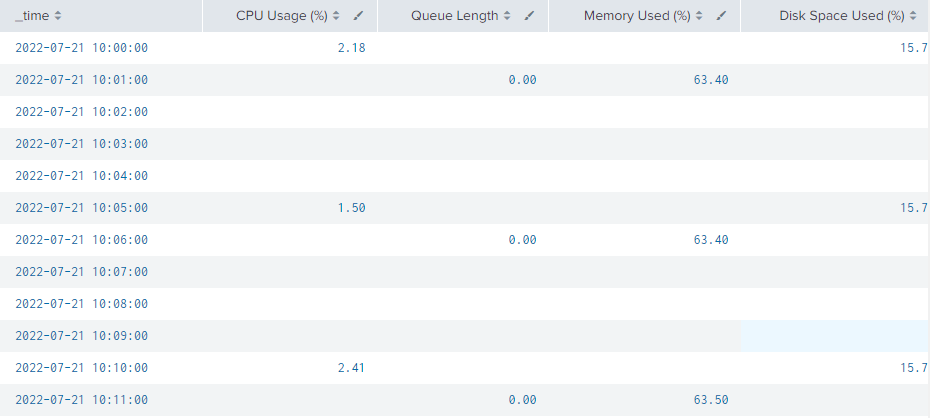
I have managed to create the following query which helps me lists out my requirements nicely in the following image. (Note that in the image, the log is set to output every 5 minutes only, hence the null values in the image below)
index=* host=abc_server tag=performance (cpu_load_percent=* OR wait_threads_count=* OR mem_free_percent=* OR storage_free_percent=*)
| eval cpu_load = 100 -  PercentIdleTime
| eval mem_used_percent = 100 - mem_free_percent
| eval storage_used_percent = 100 - storage_free_percent
| timechart eval(round(avg(cpu_load),2)) as "CPU Usage (%)",
            eval(round(avg(wait_threads_count), 2)) as "Queue Length",
            eval(round(avg(mem_used_percent), 2)) as "Memory Used (%)",
            eval(round(avg(storage_used_percent), 2)) as "Disk Space Used (%)"
For the next step however, I am unable to insert the host's name as another column. Is there a way where I can insert a new column for Host Name in a timechart as shown below?
| Host name | _time | CPU Usage | Queue Length | Memory Usage | Disk Space Usage |
| abc_server | 2022-07-21 10:00:00 | 1.00 | 0.00 | 37.30 | 9.12 |
| efg_server | 2022-07-21 10:00:00 | 0.33 | 0.00 | 26.50 | 8.00 |
| your_server | 2022-07-21 10:00:00 | 9.21 | 0.00 | 10.30 | 5.00 |
| abc_server | 2022-07-21 10:01:00 | 1.32 | 0.00 | 37.30 | 9.12 |
| efg_server | 2022-07-21 10:01:00 | 0.89 | 0.00 | 26.50 | 8.00 |
| your_server | 2022-07-21 10:01:00 | 8.90 | 0.00 | 10.30 | 5.00 |
Thanks in advance.
- Mark as New
- Bookmark Message
- Subscribe to Message
- Mute Message
- Subscribe to RSS Feed
- Permalink
- Report Inappropriate Content
Yes, you are able to. It's just a matter of adding a by clause to the timestamp command.
index=* host=abc_server tag=performance (cpu_load_percent=* OR wait_threads_count=* OR mem_free_percent=* OR storage_free_percent=*)
| eval cpu_load = 100 -  PercentIdleTime
| eval mem_used_percent = 100 - mem_free_percent
| eval storage_used_percent = 100 - storage_free_percent
| timechart eval(round(avg(cpu_load),2)) as "CPU Usage (%)",
            eval(round(avg(wait_threads_count), 2)) as "Queue Length",
            eval(round(avg(mem_used_percent), 2)) as "Memory Used (%)",
            eval(round(avg(storage_used_percent), 2)) as "Disk Space Used (%)"
    by host
If this reply helps you, Karma would be appreciated.
- Mark as New
- Bookmark Message
- Subscribe to Message
- Mute Message
- Subscribe to RSS Feed
- Permalink
- Report Inappropriate Content
To get host as a column (basically one row for each for every time bucket ), you'd have to use this alternative to timechart.
index=* host=abc_server tag=performance (cpu_load_percent=* OR wait_threads_count=* OR mem_free_percent=* OR storage_free_percent=*)
| eval cpu_load = 100 -  PercentIdleTime
| eval mem_used_percent = 100 - mem_free_percent
| eval storage_used_percent = 100 - storage_free_percent
| bucket _time
| stats eval(round(avg(cpu_load),2)) as "CPU Usage (%)",
            eval(round(avg(wait_threads_count), 2)) as "Queue Length",
            eval(round(avg(mem_used_percent), 2)) as "Memory Used (%)",
eval(round(avg(storage_used_percent), 2)) as "Disk Space Used (%)" by _time host- Mark as New
- Bookmark Message
- Subscribe to Message
- Mute Message
- Subscribe to RSS Feed
- Permalink
- Report Inappropriate Content
apparently the stats command does not understand the eval() argument. It treats it as an invalid argument
- Mark as New
- Bookmark Message
- Subscribe to Message
- Mute Message
- Subscribe to RSS Feed
- Permalink
- Report Inappropriate Content
Yes, you are able to. It's just a matter of adding a by clause to the timestamp command.
index=* host=abc_server tag=performance (cpu_load_percent=* OR wait_threads_count=* OR mem_free_percent=* OR storage_free_percent=*)
| eval cpu_load = 100 -  PercentIdleTime
| eval mem_used_percent = 100 - mem_free_percent
| eval storage_used_percent = 100 - storage_free_percent
| timechart eval(round(avg(cpu_load),2)) as "CPU Usage (%)",
            eval(round(avg(wait_threads_count), 2)) as "Queue Length",
            eval(round(avg(mem_used_percent), 2)) as "Memory Used (%)",
            eval(round(avg(storage_used_percent), 2)) as "Disk Space Used (%)"
    by host
If this reply helps you, Karma would be appreciated.

