Are you a member of the Splunk Community?
- Find Answers
- :
- Splunk Platform
- :
- Splunk Enterprise
- :
- Re: Event annotation for the min and max value of ...
- Subscribe to RSS Feed
- Mark Topic as New
- Mark Topic as Read
- Float this Topic for Current User
- Bookmark Topic
- Subscribe to Topic
- Mute Topic
- Printer Friendly Page
- Mark as New
- Bookmark Message
- Subscribe to Message
- Mute Message
- Subscribe to RSS Feed
- Permalink
- Report Inappropriate Content
Event annotation for the min and max value of a field
Hey everyone. I have never tried creating event annotation before so i am not able to grasp it properly.
I want to show a line for both min and max values of a date field. For ex.
Dates. Target
6/09/2020. X
6/10/2020. X
. .
. .
6/23/2020. X
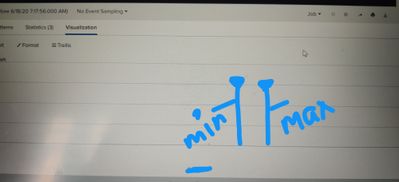
So the min and max values i.e 6/09/2020 and 6/23/2020 of dates field should be shown as lines (event annotation) .
For now the dates in between shouldn't display but later i should be able to add data for any dates and it should show as line or area chart.
And the event annotation should display target x and the date when we hover on that.
All the examples i have seen of annotations are using timecharts . I want something like the mock image below.
Any help would be great.Thanks.
- Mark as New
- Bookmark Message
- Subscribe to Message
- Mute Message
- Subscribe to RSS Feed
- Permalink
- Report Inappropriate Content
Hi @nikitha15 - just ran into the exact same problem. Let me show you what I did just for max using a search that anyone can run on their own Splunk Enterprise or Splunk Cloud deployment.
Main search is like so:
index = _internal sourcetype IN (splunk_web_access, splunkd_access)
| timechart span=h count by sourcetype
Annotation search is like so:
index = _internal sourcetype IN (splunk_web_access, splunkd_access)
| timechart span=h count by sourcetype
| eval total = splunk_web_access + splunkd_access
| stats max(total)
| rename max(total) as Max
| map search="search index = _internal sourcetype IN (splunk_web_access, splunkd_access) | timechart span=h count by sourcetype  | eval total = splunk_web_access + splunkd_access | search total=$Max$"
| eval annotation_label = "Max interactions occurred at " + strftime(_time, "%H:%M:%S") + " - total of " + total + " interactions."
| fields _time, annotation_label, total
I used map to pull out just the timespan associated with the max number of events - someone better at SPL could probably find a better approach. Note that in SimpleXML dashboards you have to use $$ around the map replacement token instead of $ in the search bar.
To show the whole dashboard:
<dashboard>
  <label>Test for nikitha15</label>
  <row>
    <panel>
      <chart>
        <search>
          <query>
            index = _internal sourcetype IN (splunk_web_access, splunkd_access)
            | timechart count by sourcetype span=h
            </query>
          <earliest>-24h@h</earliest>
          <latest>now</latest>
        </search>
        <search type="annotation">
          <query>
            index = _internal sourcetype IN (splunk_web_access, splunkd_access)
            | timechart span=h count by sourcetype
            | eval total = splunk_web_access + splunkd_access
            | stats max(total)
            | rename max(total) as Max
            | map search="search index = _internal sourcetype IN (splunk_web_access, splunkd_access) | timechart span=h count by sourcetype  | eval total = splunk_web_access + splunkd_access | search total=$$Max$$"
            | eval annotation_label = "Max interactions occurred at " + strftime(_time, "%H:%M:%S") + " - total of " + total + " interactions."
            | fields _time, annotation_label, total
          </query>
          <earliest>-24h@h</earliest>
          <latest>now</latest>
        </search>
      </chart>
    </panel>
  </row>
</dashboard>
Let me know if that's not quite answering your question.

