Join the Conversation
- Find Answers
- :
- Splunk Products
- :
- Splunk Enterprise Security
- :
- Why are OSSEC logs being sent to Splunk but not be...
- Subscribe to RSS Feed
- Mark Topic as New
- Mark Topic as Read
- Float this Topic for Current User
- Bookmark Topic
- Subscribe to Topic
- Mute Topic
- Printer Friendly Page
- Mark as New
- Bookmark Message
- Subscribe to Message
- Mute Message
- Subscribe to RSS Feed
- Permalink
- Report Inappropriate Content
Hello Splunk Community,
History of problem:
I recently was trying to update OSSEC agents and some needed to be reinstalled to be fixed. So in my plan of action for targeting, the main OSSEC server got targeted and reinstalled as an agent instead, thus having me to reconfigure everything becauase we did not have a backup. After a weekend of configuration recovery, all 100+ agents got reconnected and authenticated with new keys and updated configs for both the server and agents. Everything is connected and communicating, reporting alerts to the alerts.log, local_rules.xml file is updated. We use Splunk Forwarder to forward the logs and we get log information, but it looks like it's not being processed correctly....this is our issue.
Problem and End-Result Needed:
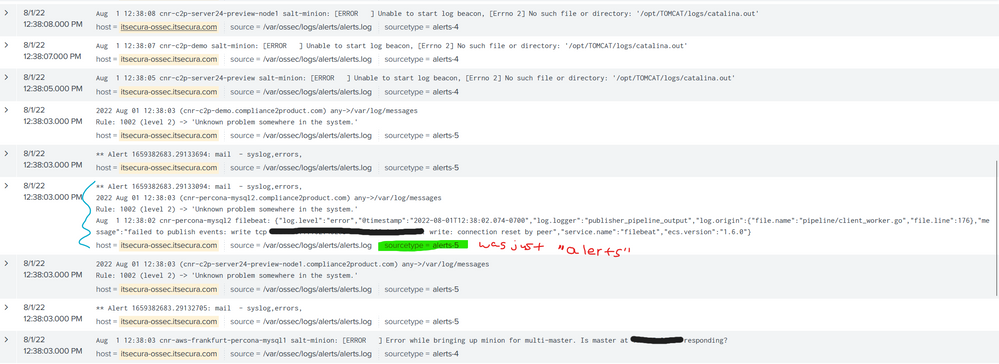
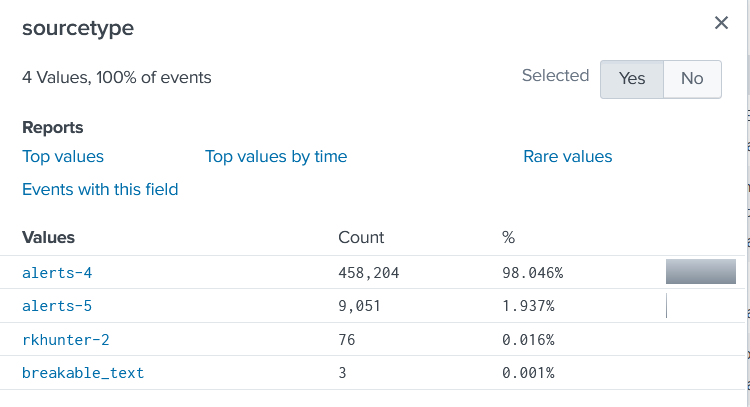
Splunk is receiving information from OSSEC server but the data is having trouble being processed by the IDS data model. Splunk field for Log "sourcetype" seems to be the root of the issue. We need to have Datamodels process this information or have the Splunk OSSEC add-on properly configured because we have the path on the splunk server, but not fully configured:
/opt/splunk/etc/apps/Splunk_TA_ossec/
What we noticed in Splunk search:
Before
Sourcetype=alerts
Current needing fix
Sourcetype=alerts-4 and Sourcetype=alerts-5
IDS (Intrusion Detection) Splunk data model needs to process logs by severity and update the dashboard accordingly
Splunk Add-on is not properly configured
Some pictures are attached of the issue.
---------------------
Resources
---------------------
https://docs.splunk.com/Documentation/AddOns/released/OSSEC/Setup
https://docs.splunk.com/Documentation/CIM/5.0.1/User/IntrusionDetection
https://docs.splunk.com/Documentation/AddOns/released/OSSEC/Sourcetypes
- Mark as New
- Bookmark Message
- Subscribe to Message
- Mute Message
- Subscribe to RSS Feed
- Permalink
- Report Inappropriate Content
We found our solution to this issue. However, our splunk dashboard is having difficulty understanding the severity level. Overtime we will fix this and update this post.
The problem was that we needed to edit our inputs.conf file with the "alerts" sourcetype in the splunkforwarder:
Path: /opt/splunkforwarder/etc/apps/Splunk_TA_nix_ossec/local/inputs.conf
Added:
[monitor:///var/ossec/logs/alerts/alerts.log]
disabled = false
index = ids
sourcetype=alerts
More information:
https://uit.stanford.edu/service/ossec/install-source


