Are you a member of the Splunk Community?
- Find Answers
- :
- Premium Solutions
- :
- Splunk Enterprise Security
- :
- Syslog & TA event ingestion
- Subscribe to RSS Feed
- Mark Topic as New
- Mark Topic as Read
- Float this Topic for Current User
- Bookmark Topic
- Subscribe to Topic
- Mute Topic
- Printer Friendly Page
- Mark as New
- Bookmark Message
- Subscribe to Message
- Mute Message
- Subscribe to RSS Feed
- Permalink
- Report Inappropriate Content
Syslog & TA event ingestion
Hi Everyone, I've inherited a splunk platform and need assistance with syslog configuration.
The current configuration is not of my design, so I would appreciate constructive critisism on how it could be improved.
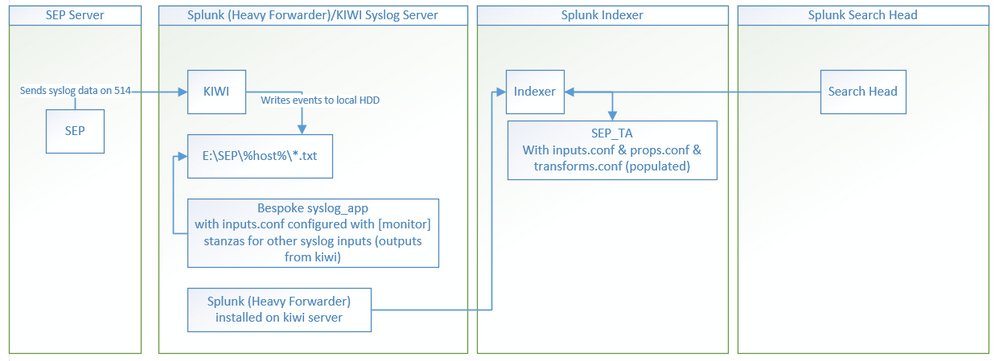
I'm trying to ingest events for the symantec endpoint protection app via syslog and below is a diagram of my current setup.
The problem is that the dashboards & searches for the symantec app aren't picking up any data, presumably due to the various configurations of inputs.conf
(1)I have the SEP sending syslog data to my Kiwi Syslog server,
(2)Which in turn writes these events to a flat file located at "E:\SEP......txt"
(3)For other apps, there's an inputs.conf as defined below that's monitoring for those flat files and assigning a source/sourcetype
(4)Splunk is installed on the syslog server as a Heavy Forwarder that's configured to send events to the indexer. (Which also has the SEP_TA installed)
Some syslog monitors were already setup using the inputs.conf of a bespoke syslog app on the heavy forwarder/kiwi server
There are many monitor stanza's contained within this bespoke app all pointing to the flat files that are exported from kiwi as follows:
[monitor://E:\Syslog\CiscoASA\...\*]
disabled = 0
host_segment = 3
sourcetype = cisco:asa
index = company_syslog

[monitor://E:\Syslog\Juniper\...\*]
disabled = 0
host_segment = 3
sourcetype = juniper
index = company_syslog

[monitor://E:\Syslog\CiscoWireless\...\*]
disabled = 0
host_segment = 3
sourcetype = syslog
index = company_syslog

[monitor://E:\Syslog\FireEye\...\*]
disabled = 0
host_segment = 3
sourcetype = syslog
index = company_syslog

[monitor://E:\Syslog\SEP\...\*]
disabled = 0
host_segment = 3
sourcetype = symantec
index = company_syslog
Although I've tried adding my own stanza pointing to the path, I can ingest data however the associated SEP dashboards don't populate. I notice also that the sourcetype is exactly as I define it in inputs.conf as "symantec" however in the SEP_TA app I notice it's looking for sourcetypes that match "symantec:atp:incidents" or "symantec:atp:incidentevents"
Where do I need to define the inputs that came with the SEP_TA? do I copy those over to my bespoke syslog app which has the monitor stanza's referenced above?
I notice the SEP_TA app's inputs.conf has script stanzas instead of monitoring as above. Will it cause any problems to have both [monitor] & [script] stanzas in the same inputs.conf?
Example:
[script://$SPLUNK_HOME/etc/apps/TA-symantec_atp/bin/atp_incidents_collect.py]
interval = 600
source = symantec_atp
sourcetype = symantec:atp:incidents
passAuth = splunk-system-user
disabled = True
#index = main
Will there be any issue adding the entries from the SEP_TA inputs.conf to the bespoke syslog app inputs.conf to have it perform the same functions?
Best Regards,
Monty
- Mark as New
- Bookmark Message
- Subscribe to Message
- Mute Message
- Subscribe to RSS Feed
- Permalink
- Report Inappropriate Content
The 'normal' SEP TA (https://splunkbase.splunk.com/app/2772/) is for use with other ingestion methods and will not work with the log format you get from symantec's syslog output.
Have a look at the specific SEP TA for use with syslog input: https://splunkbase.splunk.com/app/3121/
Make sure kiwi writes the log messages in a format that matches what the TA expects. Downside of Kiwi is that, as far as I know, it does not support writing the original full raw syslog message, but hopefully it has an output format that is suitable. If not: you may have to customize the TA a bit to make it work properly (or consider moving away from kiwi, but that is a separate discussion).
Also: what exact symantec app are you using for the dashboards you mention?
- Mark as New
- Bookmark Message
- Subscribe to Message
- Mute Message
- Subscribe to RSS Feed
- Permalink
- Report Inappropriate Content
Bump for assistance?
- Mark as New
- Bookmark Message
- Subscribe to Message
- Mute Message
- Subscribe to RSS Feed
- Permalink
- Report Inappropriate Content
The architecture looks fine. Its just a different approach to collecting the data for SEP.
To troubleshoot, execute this search:
index=company_syslog sourcetype=symantec
check if the ingested data is being parsed correctly?
Ideally, should set the sourcetype as per the Splunk Add-on for Symantec Endpoint Protection. The TA also needs to be on the Heavy Forwarder (HF), as the HF does some parsing before sending it to the indexer
Note: The current scripted stanza is disabled, so it is not pulling any data, its the monitoring stanza doing the task.

