- Find Answers
- :
- Premium Solutions
- :
- Splunk Enterprise Security
- :
- Enerprise Security posture is empty
- Subscribe to RSS Feed
- Mark Topic as New
- Mark Topic as Read
- Float this Topic for Current User
- Bookmark Topic
- Subscribe to Topic
- Mute Topic
- Printer Friendly Page
- Mark as New
- Bookmark Message
- Subscribe to Message
- Mute Message
- Subscribe to RSS Feed
- Permalink
- Report Inappropriate Content
I have installed Enterprise Security App.
I review Security Domain, in particular, Access and Network sections and I see many events coming from my AD, Office 365, and Firewalls.
However, Security Posture dashboards are all empty.
I have checked permissions and given full access.
Could you advise what I should check to fix it?
- Mark as New
- Bookmark Message
- Subscribe to Message
- Mute Message
- Subscribe to RSS Feed
- Permalink
- Report Inappropriate Content
You can also check index=notable.
Notable events are typically generated as an Adaptive Response Action for a correlation search.
You can see this from the Enterprise Security menu bar under Configure -> Content -> Content Management. Correlation searches must be enabled and search conditions met before notable events are generated and become visible from the Security Posture and Incident Review dashboards.
You can use existing correlation searches, use the Splunk ES Content Update (ESCU) app from Splunkbase at https://splunkbase.splunk.com/app/3449/, or generate your own searches using the guidance at https://docs.splunk.com/Documentation/ES/6.6.0/Admin/Correlationsearchoverview.
You can also edit the Security Posture dashboard to display other key indicators, but the default ones cover the main security domains and frameworks used by Enterprise Security.
- Mark as New
- Bookmark Message
- Subscribe to Message
- Mute Message
- Subscribe to RSS Feed
- Permalink
- Report Inappropriate Content
Thank you very much.
I enabled objects in the Content Management and Security Posture instantly filled with different events.
- Mark as New
- Bookmark Message
- Subscribe to Message
- Mute Message
- Subscribe to RSS Feed
- Permalink
- Report Inappropriate Content
Did you really check though? The Security Posture dashboard is 100% driven by notables.
Did you check if there are any notables generated?
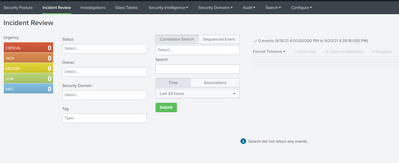
If you go the the Incident Review dashboard. Do you have any notables there?
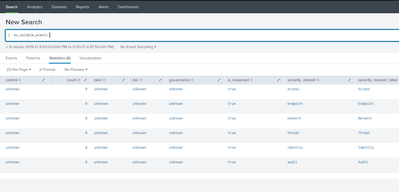
Do you get any results when you run the underlying spl queries? ;
| `es_notable_events`
or without macro and even more simple:
| inputlookup es_notable_events
- Mark as New
- Bookmark Message
- Subscribe to Message
- Mute Message
- Subscribe to RSS Feed
- Permalink
- Report Inappropriate Content
Thank you for the reply.
The Incident Review dashboard is also empty.
I have executed a request and nothing empty result.
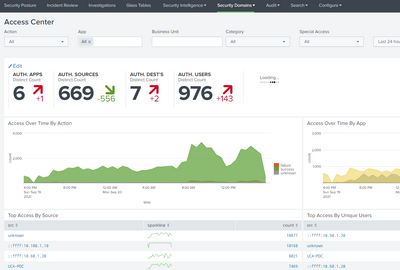
But when I review events using Security Domains, I see a lot of events.
For instance, Access Centre.
Very strange, I have no idea why this is happening in this way.
- Mark as New
- Bookmark Message
- Subscribe to Message
- Mute Message
- Subscribe to RSS Feed
- Permalink
- Report Inappropriate Content
Why would it be strange? No notables means no data in the Security Posture dashboard....
Next step for you would be to figure out why you do not have any notables.
Create some test notables.
You can create them this way:
makeresults | eval dest="splunkftw" | sendalert notable
I'm more worried about the lack of ES knowledge and the task that you got to install and configure ES...
Check this:
https://dev.splunk.com/enterprise/docs/devtools/enterprisesecurity/notableeventsplunkes/
- Mark as New
- Bookmark Message
- Subscribe to Message
- Mute Message
- Subscribe to RSS Feed
- Permalink
- Report Inappropriate Content
Thank you very much.
You are right, I do not have appropriate knowledge in ES. 😞
Hope, I will fix it in the near future.
After enabling objects in Content Management, I started receiving notable events.


