Turn on suggestions
Auto-suggest helps you quickly narrow down your search results by suggesting possible matches as you type.
Splunk Dev
×
Are you a member of the Splunk Community?
Sign in or Register with your Splunk account to get your questions answered, access valuable resources and connect with experts!
Turn on suggestions
Auto-suggest helps you quickly narrow down your search results by suggesting possible matches as you type.
- Find Answers
- :
- Apps & Add-ons
- :
- Splunk Development
- :
- Splunk Dev
- :
- How to pull Meraki Syslog into Splunk in order to ...
Options
- Subscribe to RSS Feed
- Mark Topic as New
- Mark Topic as Read
- Float this Topic for Current User
- Bookmark Topic
- Subscribe to Topic
- Mute Topic
- Printer Friendly Page
- Mark as New
- Bookmark Message
- Subscribe to Message
- Mute Message
- Subscribe to RSS Feed
- Permalink
- Report Inappropriate Content
How to pull Meraki Syslog into Splunk in order to monitor internal port scanning?
cbcadmin
Loves-to-Learn Lots
07-18-2022
02:35 PM
Hey all,
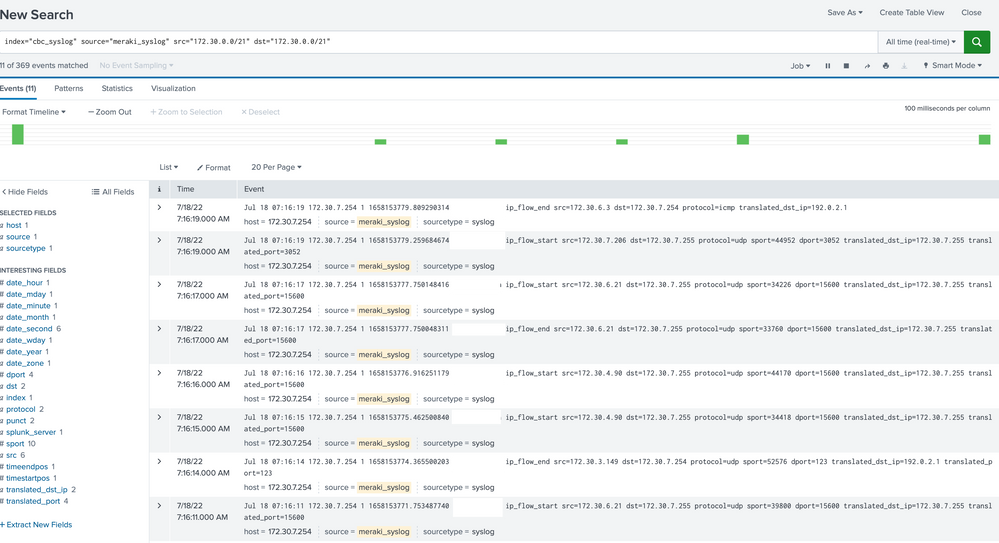
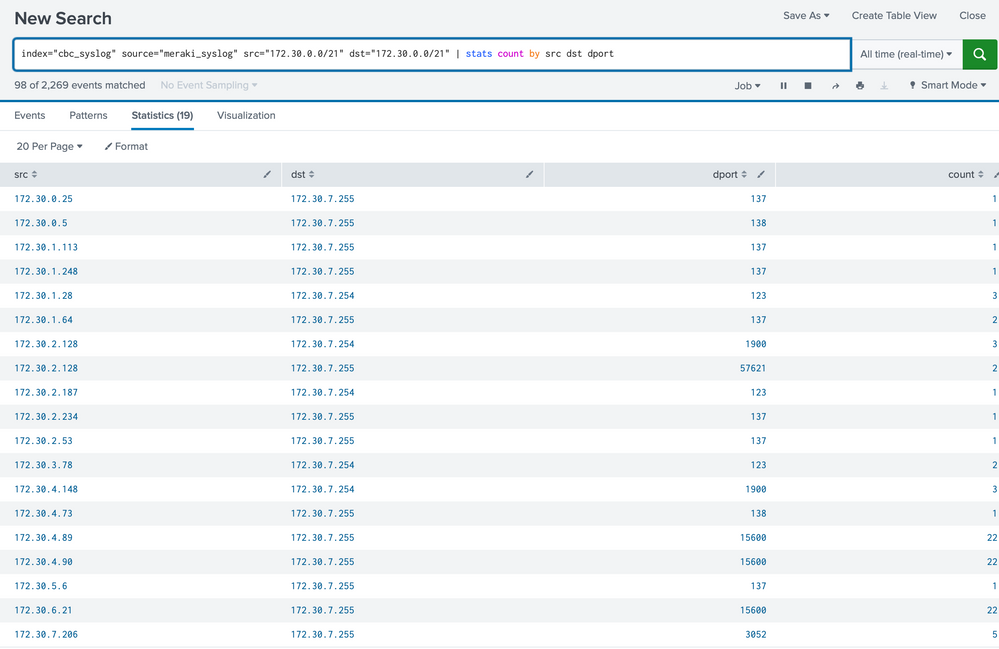
I'm trying to pull in the Syslog or our Meraki MX to our on-premise Splunk Enterprise in order to monitor internal port scanning. Right now I have the Syslogs coming in via the Data input > UDP (514). I see all the data being pulled in correctly however when I search internal traffic communication it shows everything going to the broadcast IP. I'm not sure if I should be using a different method, but I would appreciate some guidance on best practices to monitor internet traffic.
Thanks!
Career Survey
First 500 qualified respondents will receive a $20 gift card! Tell us about your professional Splunk journey.
Get Updates on the Splunk Community!
Tech Talk Recap | Mastering Threat Hunting
Mastering Threat HuntingDive into the world of threat hunting, exploring the key differences between ...
Observability for AI Applications: Troubleshooting Latency
If you’re working with proprietary company data, you’re probably going to have a locally hosted LLM or many ...
Splunk AI Assistant for SPL vs. ChatGPT: Which One is Better?
In the age of AI, every tool promises to make our lives easier. From summarizing content to writing code, ...


