
Join the Conversation
- Find Answers
- :
- Using Splunk
- :
- Other Using Splunk
- :
- Reporting
- :
- Re: remove scrollbar
- Subscribe to RSS Feed
- Mark Topic as New
- Mark Topic as Read
- Float this Topic for Current User
- Bookmark Topic
- Subscribe to Topic
- Mute Topic
- Printer Friendly Page
- Mark as New
- Bookmark Message
- Subscribe to Message
- Mute Message
- Subscribe to RSS Feed
- Permalink
- Report Inappropriate Content
remove scrollbar

When I download dashboard by PDF or PNG, scrollbar is showing although it doesn't appear in the dashboard page like below picture. (dashboard type is Dashboard Studio)
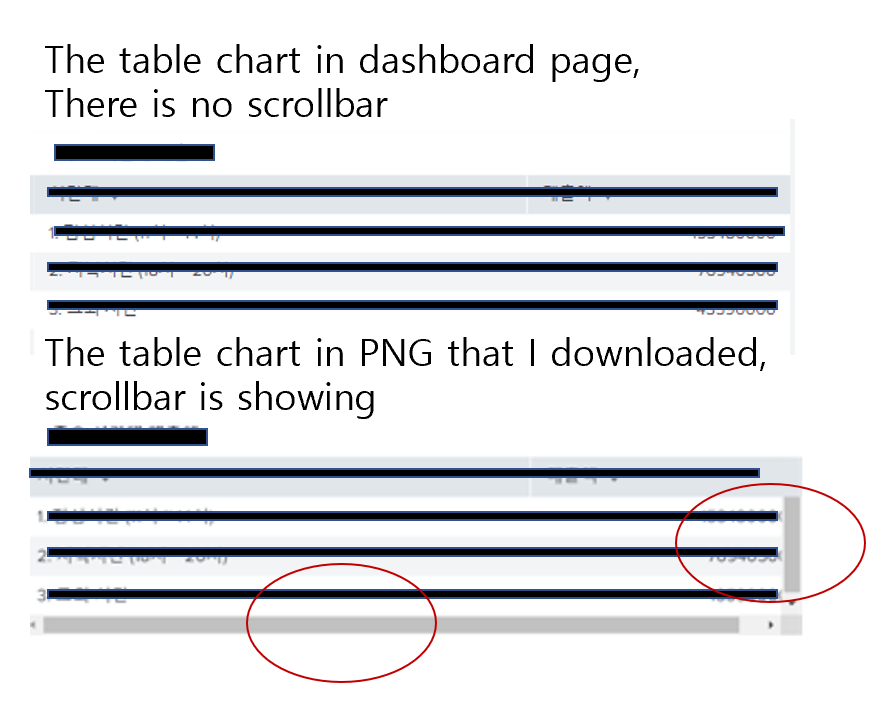
How can I solve it?
- Mark as New
- Bookmark Message
- Subscribe to Message
- Mute Message
- Subscribe to RSS Feed
- Permalink
- Report Inappropriate Content


- Mark as New
- Bookmark Message
- Subscribe to Message
- Mute Message
- Subscribe to RSS Feed
- Permalink
- Report Inappropriate Content
splunk version = 8.2.1
I think there is no XML because the dashboard type is Dashboard Studio.
If I am wrong, where can I find dashboard xml ?
- Mark as New
- Bookmark Message
- Subscribe to Message
- Mute Message
- Subscribe to RSS Feed
- Permalink
- Report Inappropriate Content
You can find the XML in same place.
splunk/etc/apps/your_app/local/data/ui/views/
I tried to reproduce the issue but no luck. Can you please share steps to reproduce?
Are you able to reproduce the issue with new dashboard also?
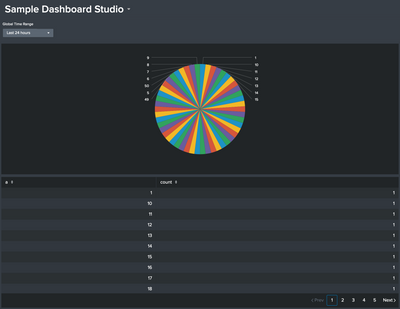
This is downloaded PNG file from my instance.
KV
- Mark as New
- Bookmark Message
- Subscribe to Message
- Mute Message
- Subscribe to RSS Feed
- Permalink
- Report Inappropriate Content
there is xml code below.
<dashboard version="2" theme="light">
<label>Dashboard example</label>
<description></description>
<definition>
<![CDATA[{
"visualizations": {
"viz_2A5srF82": {
"type": "viz.pie",
"dataSources": {
"primary": "ds_l0B8uu8y"
},
"options": {
"chart.showLabels": false
}
},
"viz_YWCuaFHT": {
"type": "viz.pie",
"dataSources": {
"primary": "ds_532sOOCK"
},
"options": {
"chart.showLabels": false
}
},
"viz_n327J8Fi": {
"type": "splunk.table",
"dataSources": {
"primary": "ds_IuVwbCSd"
},
"options": {
"count": 14,
"headerVisibility": "fixed"
}
},
"viz_oZWOQFPg": {
"type": "viz.line",
"dataSources": {
"primary": "ds_yt2pXYLD"
},
"options": {
"legend.placement": "none",
"chart.showDataLabels": "all"
}
},
"viz_tKTE9NXg": {
"type": "splunk.table",
"dataSources": {
"primary": "ds_3ZmDAmnq"
},
"options": {
"count": 5,
"headerVisibility": "fixed"
}
},
"viz_HEcFyl4Q": {
"type": "viz.line",
"dataSources": {
"primary": "ds_s4d57KyZ"
},
"options": {
"chart.showDataLabels": "all",
"legend.placement": "none"
}
}
},
"dataSources": {
--SKIP--
},
"defaults": {
"dataSources": {
"ds.search": {
"options": {
"queryParameters": {
"latest": "$global_time.latest$",
"earliest": "$global_time.earliest$"
}
}
}
}
},
"inputs": {
"input_global_trp": {
"type": "input.timerange",
"options": {
"token": "global_time",
"defaultValue": "-24h@h,now"
},
"title": "Time Range"
}
},
"layout": {
"type": "absolute",
"options": {
"display": "auto-scale"
},
"structure": [
{
"item": "viz_2A5srF82",
"type": "block",
"position": {
"x": 0,
"y": 0,
"w": 620,
"h": 350
}
},
{
"item": "viz_YWCuaFHT",
"type": "block",
"position": {
"x": 610,
"y": 0,
"w": 590,
"h": 350
}
},
{
"item": "viz_n327J8Fi",
"type": "block",
"position": {
"x": 0,
"y": 350,
"w": 570,
"h": 550
}
},
{
"item": "viz_oZWOQFPg",
"type": "block",
"position": {
"x": 570,
"y": 530,
"w": 630,
"h": 200
}
},
{
"item": "viz_tKTE9NXg",
"type": "block",
"position": {
"x": 570,
"y": 350,
"w": 630,
"h": 180
}
},
{
"item": "viz_HEcFyl4Q",
"type": "block",
"position": {
"x": 570,
"y": 720,
"w": 630,
"h": 180
}
}
],
"globalInputs": [
"input_global_trp"
]
},
"description": "",
"title": "Dashboard example"
}]]>
</definition>
<assets><![CDATA[{}]]></assets>
</dashboard>
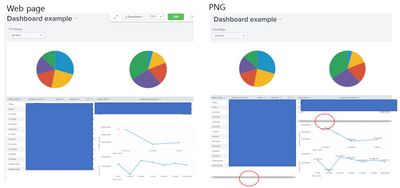
In my case, there are several charts in the dashboard like that pic below.
- Mark as New
- Bookmark Message
- Subscribe to Message
- Mute Message
- Subscribe to RSS Feed
- Permalink
- Report Inappropriate Content


Join the Splunk Community Slack to learn, troubleshoot, and make connections with fellow Splunk practitioners in real time!
Join Splunk User Groups to connect and learn in-person by region or remotely by topic or industry.
Vibe-coding, AI, and Splunkcraft: Highlights from the .conf26 Builder Bar
Thanks for the Memories: .conf26 Took Learning to New Heights
Best Practices: Splunk auto adjust pipeline queue
