- Find Answers
- :
- Using Splunk
- :
- Other Using Splunk
- :
- Reporting
- :
- How to achieve day histogram in 20 minute interval...
- Subscribe to RSS Feed
- Mark Topic as New
- Mark Topic as Read
- Float this Topic for Current User
- Bookmark Topic
- Subscribe to Topic
- Mute Topic
- Printer Friendly Page
- Mark as New
- Bookmark Message
- Subscribe to Message
- Mute Message
- Subscribe to RSS Feed
- Permalink
- Report Inappropriate Content
The code below does create a table/ scatter plot showing the warnings per hour of day.
All warnings between 00:00 and 00:59 will be counted/ listed in date_hour 0, warnings from 01:00 until 01:59 will be counted in date_hour 1, ....
If the time range is set across multiple days I still have the date_hours 0...23 all the warnings will be added independent of the date.
index="..." sourcetype="..."
| strcat opc "_" frame_num "_" elem_id uniqueID
| search status_1="DRW 1*"
| stats count as warning by date_hour, uniqueID
| table uniqueID date_hour warning
For the kind of evaluation we're doing we would need to have shorter counting intervals than the one given by date_hour, e.g. 20 minutes.
The question is: how to update the code to get counting intervals smaller than one hour???
Below I managed to reduce the time interval to 20 minutes.
index="..." sourcetype="..."
| strcat opc "_" frame_num "_" elem_id uniqueID
| search status_1="DRW 1*"
| bin _time span=20m as interval
| stats count as warning by interval, uniqueID
| table uniqueID interval warning
But: the date is still in there so I have a 20 min counting interval one day after the other. And the interval string is no more human readyble in the table.
Any help is appreciated.
- Mark as New
- Bookmark Message
- Subscribe to Message
- Mute Message
- Subscribe to RSS Feed
- Permalink
- Report Inappropriate Content
index="..." sourcetype="..."
| strcat opc "_" frame_num "_" elem_id uniqueID
| search status_1="DRW 1*"
| bin _time span=20m as interval
| eval interval = strftime(interval,"%H:%M")
| stats count as warning by interval, uniqueID
| table uniqueID interval warning- Mark as New
- Bookmark Message
- Subscribe to Message
- Mute Message
- Subscribe to RSS Feed
- Permalink
- Report Inappropriate Content
Most probably I got it:
index="..." sourcetype="..."
| strcat opc "_" frame_num "_" elem_id uniqueID
| search status_1="DRW 1*"
| bin _time span=20m as interval
| eval interval = strftime(interval,"%H.%M")
| stats count as warning by interval, uniqueID
| table uniqueID interval warning
Changing the format string from "%H:%M" to "%H.%M" seems to do the trick
- Mark as New
- Bookmark Message
- Subscribe to Message
- Mute Message
- Subscribe to RSS Feed
- Permalink
- Report Inappropriate Content
@ITWhisperer Thank you, that was fast.
I do get now a proper table with exactly the data I was looking for.
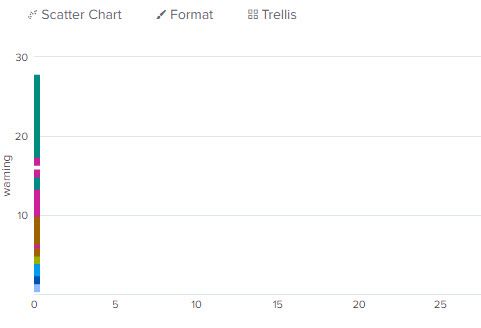
But if I try to display this table as a scatter plot via Visualization I got a strange plot:
It looks like the scatter plot can not handle the interval information.
- Mark as New
- Bookmark Message
- Subscribe to Message
- Mute Message
- Subscribe to RSS Feed
- Permalink
- Report Inappropriate Content
index="..." sourcetype="..."
| strcat opc "_" frame_num "_" elem_id uniqueID
| search status_1="DRW 1*"
| bin _time span=20m as interval
``` scatter plot will need a numeric ```
| eval interval = tonumber(strftime(interval,"%H%M"))
| stats count as warning by interval, uniqueID
| table uniqueID interval warning- Mark as New
- Bookmark Message
- Subscribe to Message
- Mute Message
- Subscribe to RSS Feed
- Permalink
- Report Inappropriate Content
index="..." sourcetype="..."
| strcat opc "_" frame_num "_" elem_id uniqueID
| search status_1="DRW 1*"
| bin _time span=20m as interval
| eval interval = strftime(interval,"%H:%M")
| stats count as warning by interval, uniqueID
| table uniqueID interval warning
