Are you a member of the Splunk Community?
- News & Events
- :
- Blog & Announcements
- :
- Product News & Announcements
- :
- Splunk Observability Announces new Capabilities to...
Splunk Observability Announces new Capabilities to Help you Build, Troubleshoot, and Innovate Faster
- Subscribe to RSS Feed
- Mark as New
- Mark as Read
- Bookmark Topic
- Subscribe
- Printer Friendly Page
- Report Inappropriate Content
It’s been a tremendous year of innovation at Splunk and we’re excited to introduce new features to help DevOps, IT Operations, and software development teams build, troubleshoot, and innovate faster. Our customers are undergoing large-scale initiatives around IT Modernization, cloud migration, and application modernization. With more data, dependencies, and changes from production environments, there are more failure scenarios than teams can ever anticipate, and there is more to monitor and react to. Splunk Observability is the only solution providing: end-to-end visibility across hybrid landscapes, AIOps capabilities for full correlation of logs, metrics, and traces to predict and prevent problems before they impact customers, and AI-directed troubleshooting that leverages a unified entity model which analyzes 100% of unsampled telemetry data to pinpoint issues that impact services and customers the most. Let’s take a spin through the new innovations, with a bit of context for each.
End-to-end Visibility Across Your Hybrid Cloud
It’s hard to measure how infrastructure health and application performance impacts your digital customer experience when you have to switch between tools or different monitoring experiences. With observability integrated as part of the broader Splunk platform, only Splunk instruments your entire tech landscape from packaged applications running on-prem (like order processing or fulfillment systems from third-party vendors) to cloud-native web applications with no sampling, so you can get end-to-end visibility and rapidly correlate issues that are impacting multiple parts of your entire software stack.
New innovations include:
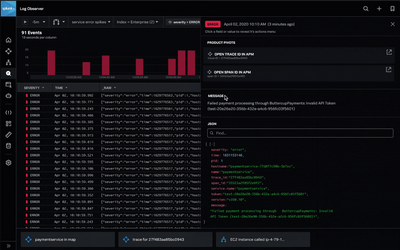
Splunk Log Observer Connect is now generally available. This capability of Splunk Log Observer connects your logs to metrics and traces, helping you understand which logs are dependent on infrastructure and applications as you investigate performance problems. More context across metrics, traces, and log data helps quickly scope issues in production environments, isolate latency, and identify granular details to understand the root cause, faster.
Log Observer Connect helps joins log, metric, and trace data in context to scope and isolate performance problems across your infrastructure and applications (image source)
Another capability helping expand your ability to connect granular log data with metrics is the preview of Logs in Observability Dashboards. You can now combine logs and metrics together in your Observability dashboards to help you scope an issue’s severity and reach, and quickly drill down with more granularity as you investigate possible causes.
With the preview of auto-instrumentation of Java applications via the OpenTelemetry Collector, you can start streaming their traces and monitor your distributed applications with Splunk APM in minutes. This feature reduces the time to getting data into Splunk Observability Cloud, providing immediate value with no configuration for the instrumentation, and data collection agents.
The general availability of our Infrastructure Navigator 2.0, from Splunk Infrastructure Monitoring, provides immediate full stack visibility across hosts, containers, databases, and services spanning hybrid cloud environments. Engineers can quickly diagnose health and performance problems across their tech stack with easy-to-use functionality and friendly pivot sidebars, which intelligently guide users to performance problems in complex infrastructure environments.
Predict and Prevent Problems Before Your Customers Notice
It's impossible to anticipate unknowns when you are solely dependent on alerts to know what's changing. AIOps is baked into Splunk Observability, making it possible to predict and prevent problems before they turn into customer-impacting incidents.
New innovations include:
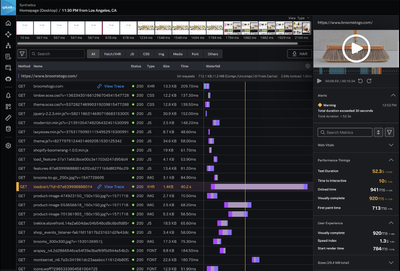
We’ve integrated our Synthetic Monitoring capabilities into Splunk Observability in preview form, helping you proactively test and monitor the uptime and performance of your critical APIs, services, and customer experience, in a single user interface. Synthetic Monitoring within Splunk Observability enables you to detect and resolve issues before customers are impacted, with seamless context across both your client side and backend performance.
Best-in-class synthetic monitoring in Splunk Observability provides full-page performance breakdowns, with filmstrips and video playback to visualize customer experience (image source)
For IT Service Intelligence (ITSI), we’ve listened to your feedback, and are adding three capabilities voted as your top priorities on ideas.Splunk.com. First, the general availability of Splunk Observability content pac, Version 2, includes everything from high-level Executive Glass Tables for quick summaries, to quick navigation out of ITSI and IT Essentials Work into Splunk Observability for further investigation into end-user experience with Splunk RUM, application performance with Splunk APM, and infrastructure health with Splunk Infrastructure Monitoring. The preview of Custom Threshold Windows helps identify when an expected abnormal behavior may arise to help reduce alert fatigue and prepare for upcoming changes in your KPIs and services. Our Service Now Content Pack is now generally available. This capability brings in key data from your ServiceNow instances, such as events, change requests, incidents, and business applications, making them all easily visible and available.
For engineers looking to quickly understand and troubleshoot their infrastructure, AutoDetect with Customization is generally available. This capability provides intuitive alert integrations and workflows that offer a consolidated view of infrastructure alerts, and real-time streaming analytics to instantly detect critical patterns and anomalies.
AI-directed Troubleshooting to Know Where to Look
It’s hard to find the root cause of problems when you have to manually sift through dashboards to try to piece together answers to problems and find a problematic needle in a stack of needles. Only Splunk provides a directed troubleshooting experience that includes business context and tells you where to look when investigating a problem, for more rapid MTTR.
New innovation includes:
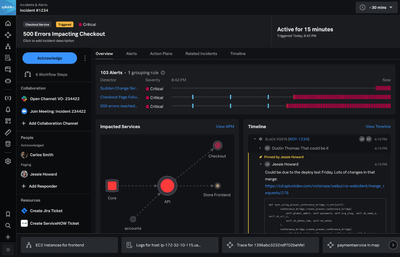
We’re announcing the preview of Splunk Incident Intelligence on Splunk Observability Cloud to help IT and DevOps teams prevent unplanned downtime with full-stack, full-context alerting. This new solution reduces alert noise with out-of-the-box correlation for Splunk and 3rd party alerts, so incident responders can improve their mean time to acknowledge issues. Incident Intelligence automates the entire incident response workflow from scheduling to post-incident reviews and integrates with Slack, Microsoft Teams, and ServiceNow to improve collaboration, knowledge base, and Mean Time to Resolve incidents.
Splunk Incident Intelligence helps incident response teams prevent unplanned downtime and reduce their mean time to acknowledge and resolve issues impacting critical services. (image source)
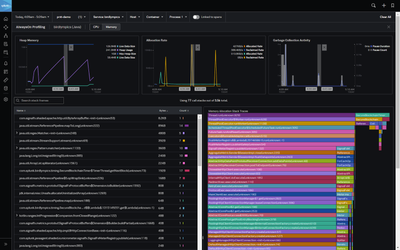
We’re extending Splunk APM’s AlwaysOn Profiling’s capabilities to continuously monitor your CPU and memory. Previews are available for CPU profiling of Node.js and .NET applications, and Memory profiling for Java applications. Engineers can now continuously monitor code level performance to find service bottlenecks in your Node.js and .NET applications, and understand how code impacts memory usage in Java applications.
Splunk APM’s AlwaysOn Memory Profiling helps pinpoint code responsible for high memory consumption (image source)
Try Splunk for Observability Today
We encourage you to continue your Splunk journey and try our Observability capabilities. Whether you’re a current Splunk user looking to expand best in class security or logging capabilities, or want to unify your IT and engineering teams in a single platform for your IT Modernization, cloud migration, or application modernization initiatives, Splunk Observability helps solve problems faster, as you scale.
Try Splunk Observability today in our free trial!
— Mat Ball, Sr. Product Marketing Manager - DevOps Solutions
You must be a registered user to add a comment. If you've already registered, sign in. Otherwise, register and sign in.
Index This | When is October more than just the tenth month?
Observe and Secure All Apps with Splunk
What’s New & Next in Splunk SOAR
-
Accessibility
1 -
App Developer
39 -
Cloud Platform
65 -
Data Management
11 -
Observability
51 -
Platform
51 -
Security
31 -
Splunk AppDynamics
8 -
Splunk Cloud Platform
13 -
Splunk Enterprise
58 -
Splunk Enterprise Security
59 -
Splunk ITSI
17 -
Splunk Observability Cloud
107 -
Splunk SOAR
16


