Join the Conversation
- Find Answers
- :
- Splunk Administration
- :
- Monitoring Splunk
- :
- Why is a REST call so slow
- Subscribe to RSS Feed
- Mark Topic as New
- Mark Topic as Read
- Float this Topic for Current User
- Bookmark Topic
- Subscribe to Topic
- Mute Topic
- Printer Friendly Page
- Mark as New
- Bookmark Message
- Subscribe to Message
- Mute Message
- Subscribe to RSS Feed
- Permalink
- Report Inappropriate Content
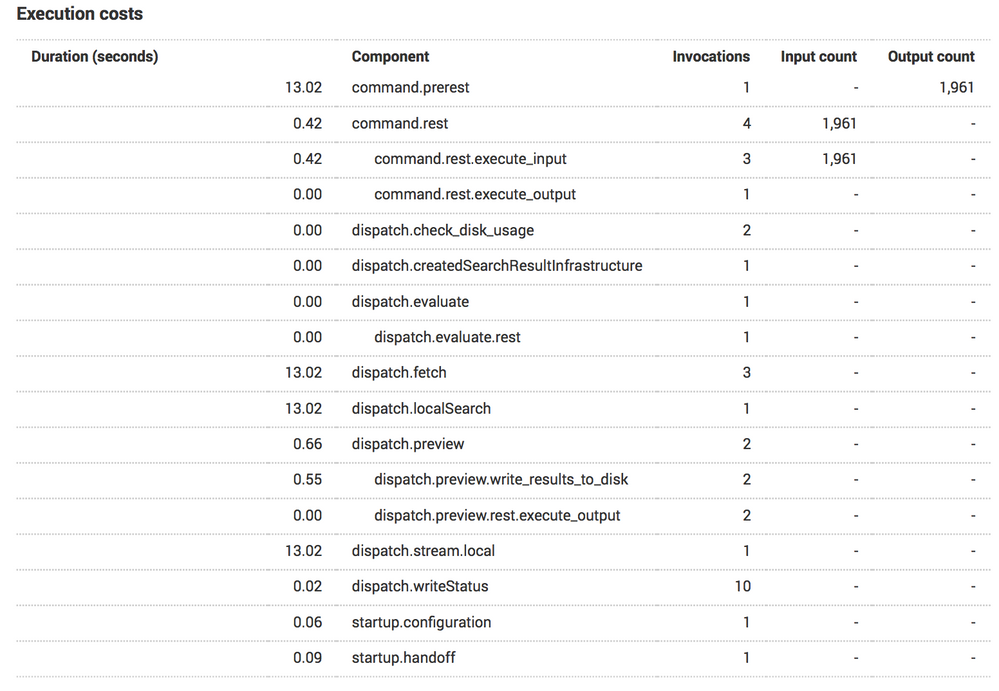
Just saw an environment where it was taking 15 seconds to run | rest /services/search/jobs splunk_server=local while in another environment it took 0.121 seconds (about a tenth of a second!). Why would a simple rest call, such as this, take so dang long?
Anyone have insights?
The Search Job Property "Custom" was:
{
"dispatch.earliest_time": "‐15m",
    "dispatch.latest_time": "now",
    "dispatch.sample_ratio": "1",
    "display.general.type": "statistics",
    "display.page.search.mode": "fast",
    "display.page.search.tab": "statistics",
    "search": "| rest /services/search/jobs splunk_server=local"
}
- Mark as New
- Bookmark Message
- Subscribe to Message
- Mute Message
- Subscribe to RSS Feed
- Permalink
- Report Inappropriate Content
The jobs endpoint has to iterate over all of the entries in the dispatch directory. More jobs = more time. It could also come down to storage performance on the SH itself.
What were the respective number of results found between the two environments?
- Mark as New
- Bookmark Message
- Subscribe to Message
- Mute Message
- Subscribe to RSS Feed
- Permalink
- Report Inappropriate Content
Working with SloshBurch on this, and the number of events that we receive are 2817 events. Is that a lot?
- Mark as New
- Bookmark Message
- Subscribe to Message
- Mute Message
- Subscribe to RSS Feed
- Permalink
- Report Inappropriate Content
Considering that the default limit where you start to get warnings from Splunk on a high number of dispatch directories is 3000, yeah, it's a lot. Consider that to get information about the jobs you have to go read through some metadata in each of those dispatch dirs, so it's now about speed of IO on that SH.

