Are you a member of the Splunk Community?
- Find Answers
- :
- Splunk Administration
- :
- Monitoring Splunk
- :
- Re: Where do I find System Activity information in...
- Subscribe to RSS Feed
- Mark Topic as New
- Mark Topic as Read
- Float this Topic for Current User
- Bookmark Topic
- Subscribe to Topic
- Mute Topic
- Printer Friendly Page
- Mark as New
- Bookmark Message
- Subscribe to Message
- Mute Message
- Subscribe to RSS Feed
- Permalink
- Report Inappropriate Content
Where do I find System Activity information in a 6.4.x Distributed Management Console?
Hi there,
The Activity > System Activity was very useful in the previous Splunk versions, letting you quickly access to last Errors and the like.
It has been removed in 6.4.
The documentation says it is now included in the Distributed Management Console:
The information shown in the System Activity view in earlier versions of Splunk Enterprise is now included in Distributed Management Console views. The System Activity view is removed from this version of Splunk Enterprise. For more information, see the Distributed Management Console Manual.
I cannot manage to find the equivalent in the DMC. Anyone with better eyes than mine find it?
Thanks in advance
- Mark as New
- Bookmark Message
- Subscribe to Message
- Mute Message
- Subscribe to RSS Feed
- Permalink
- Report Inappropriate Content
- Mark as New
- Bookmark Message
- Subscribe to Message
- Mute Message
- Subscribe to RSS Feed
- Permalink
- Report Inappropriate Content
Well, I am looking for the views that were in old System Activity view like last splunkd errors, users activity etc
And yes, this is just a standalone Splunk in lab!
- Mark as New
- Bookmark Message
- Subscribe to Message
- Mute Message
- Subscribe to RSS Feed
- Permalink
- Report Inappropriate Content
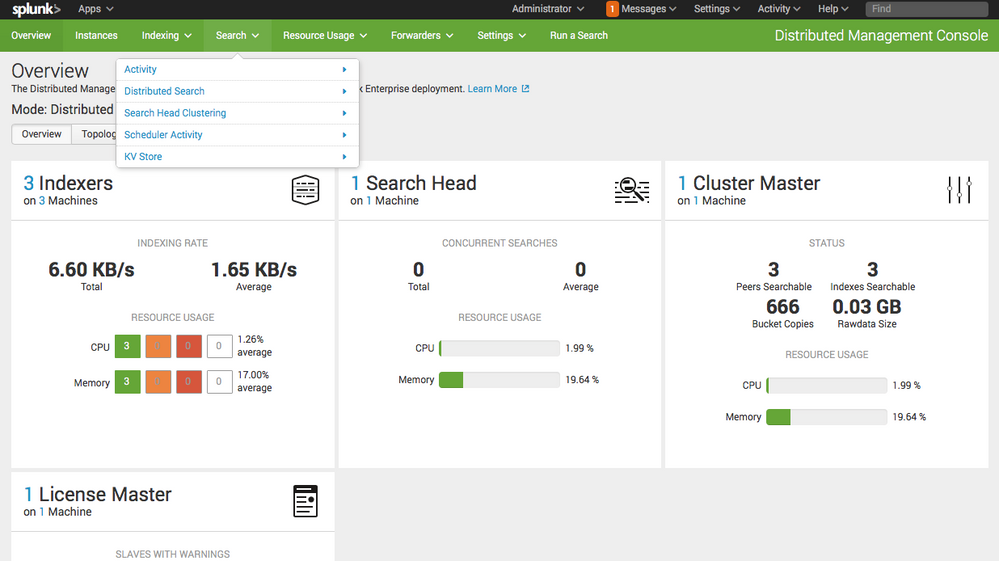
Check out Search Usage Statistics and the Overview.
- Mark as New
- Bookmark Message
- Subscribe to Message
- Mute Message
- Subscribe to RSS Feed
- Permalink
- Report Inappropriate Content
Hi MuS,
Thanks but damn, in 6.4.1 I don't even have that :

- Mark as New
- Bookmark Message
- Subscribe to Message
- Mute Message
- Subscribe to RSS Feed
- Permalink
- Report Inappropriate Content
What information are you looking for? It looks like your DMC is in standalone mode. If you have a multi-instance deployment, you can set it up like MuS did to view data from all instances in your deployment. Here's what you need to do for that:
http://docs.splunk.com/Documentation/Splunk/6.4.1/DMC/Deploymentsetupsteps
- Mark as New
- Bookmark Message
- Subscribe to Message
- Mute Message
- Subscribe to RSS Feed
- Permalink
- Report Inappropriate Content
Which information in particular are you looking for?
The docs have a super abbreviated sampling of information you can find in DMC dashboards:
http://docs.splunk.com/Documentation/Splunk/6.4.0/DMC/WhatcanDMCdo

