- Find Answers
- :
- Splunk Administration
- :
- Monitoring Splunk
- :
- Re: The percentage of high priority searches delay...
- Subscribe to RSS Feed
- Mark Topic as New
- Mark Topic as Read
- Float this Topic for Current User
- Bookmark Topic
- Subscribe to Topic
- Mute Topic
- Printer Friendly Page
- Mark as New
- Bookmark Message
- Subscribe to Message
- Mute Message
- Subscribe to RSS Feed
- Permalink
- Report Inappropriate Content
The percentage of high priority searches delayed
I see the below error message on my search head cluster can some one help me to fix this.
The percentage of high priority searches delayed (11%) over the last 24 hours is very high and exceeded the red thresholds (10%) on this Splunk instance. Total Searches that were part of this percentage=8313. Total delayed Searches=915
- Mark as New
- Bookmark Message
- Subscribe to Message
- Mute Message
- Subscribe to RSS Feed
- Permalink
- Report Inappropriate Content
Consult the Monitoring Console to find out which searches are delayed and why.
You may have too many searches trying to run at the same time. If that's the case, adjust the search schedules to they run at different times.
Verify that all searches are finishing before the next scheduled run time. If they cannot complete in time, change the schedule so they run less frequently.
If this reply helps you, Karma would be appreciated.
- Mark as New
- Bookmark Message
- Subscribe to Message
- Mute Message
- Subscribe to RSS Feed
- Permalink
- Report Inappropriate Content
- Mark as New
- Bookmark Message
- Subscribe to Message
- Mute Message
- Subscribe to RSS Feed
- Permalink
- Report Inappropriate Content
If this reply helps you, Karma would be appreciated.
- Mark as New
- Bookmark Message
- Subscribe to Message
- Mute Message
- Subscribe to RSS Feed
- Permalink
- Report Inappropriate Content
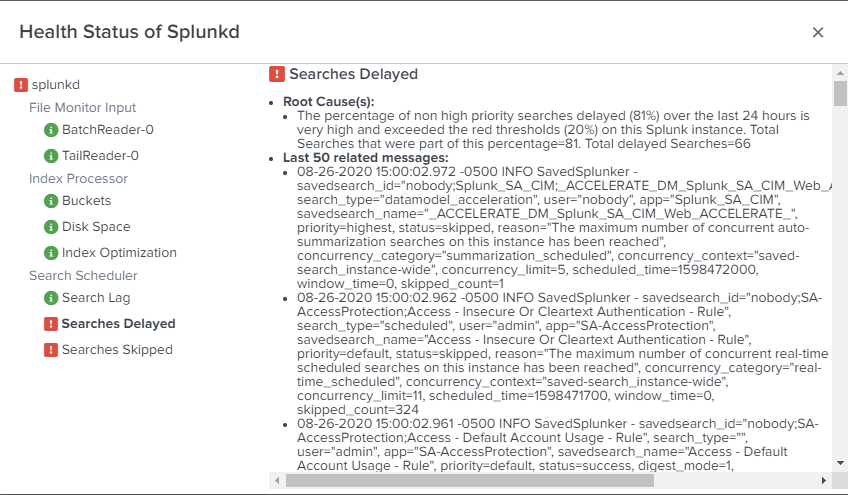
Starting from the position of a person who presents an error message, it is normal for them to manifest the error that appears.
"The percentage of non high priority searches delayed (81%) over the last 24 hours is very high and exceeded the red thresholds (20%) on this Splunk instance. Total Searches that were part of this percentage=81. Total delayed Searches=66"
I have not activated anything other than the correlation events and queries that splunk enterprise security brings by default, I just set them from inactive to active.
The more detailed answer I would like to receive:
What is the possible cause?
Where should I check?
in this thread someone said "go to monitor and check" and? If I find X or Y value, how should I proceed later?
If I have to modify the limits.conf file what is the path of that file?
What are the values that I should add or modify from that file?
- Mark as New
- Bookmark Message
- Subscribe to Message
- Mute Message
- Subscribe to RSS Feed
- Permalink
- Report Inappropriate Content
I have not activated anything other than the correlation events and queries that splunk enterprise security brings by default, I just set them from inactive to active.
This may be your first mistake. Enabling all of the built-in searches in ES is asking for trouble. Not all ES correlation searches apply to all environments so it's essential to review each CS to determine if it should be enabled.
What is the possible cause?
The cause is given in the message. You're running too many searches at a time.
Where should I check?
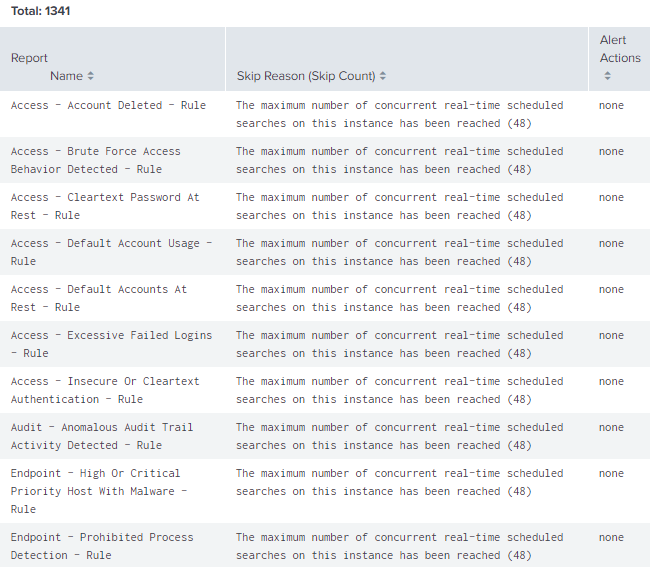
Start with the Monitoring Console. Select Search->Scheduler Activity: Instance then scroll down to the "Count of Skipped Reports by Name and Reason" panel. This will list the most commonly skipped searches.
Take a look at the "Count of Skipped Reports Over Time" graph. It will show the time of day when searches are skipped. Make note of the high and low periods so you can change schedules from peak times to non-peak times.
If I have to modify the limits.conf file what is the path of that file?
You probably will not have to modify limits.conf, however, there are several places where the file could be. The most likely place is $SPLUNK_HOME/etc/system/local, however, config files can be in any app directory. You can use btool to find the config file that contains the setting you want to change, but the setting can be overridden by any app with greater precedence (see https://docs.splunk.com/Documentation/Splunk/8.0.5/Admin/Wheretofindtheconfigurationfiles)
splunk btool --debug limits list | grep -i "<setting>"What are the values that I should add or modify from that file?
You shouldn't need to modify anything in limits.conf. Try to reduce the number of searches running at any given time before resorting to increasing the run limit.
Disable any search or datamodel acceleration that is not used or has no data. For the rest of the searches, set the Schedule Window to "auto". This will let Splunk automatically adjust the start time of a search instead of skipping it.
Review the schedule of each search. To see them in one place, run this search:
| rest splunk_server=local /servicesNS/-/-/saved/searches
| search is_scheduled=1 disabled=0
| fields dispatch.earliest_time dispatch.latest_time eai:acl.owner eai:acl.sharing search cron_schedule title
| rename dispatch.earliest_time as earliest_time, dispatch.latest_time as latest_time, eai:acl.owner as owner, eai:acl.sharing as sharing
| table title cron_schedule earliest_time latest_time schedule_window owner sharing
Look for many searches starting at the same time. It's very common, for instance, for most searches to start at the top of the hour, but it's not always necessary to do so. For each search that starts at the same time, adjust the schedule so the searches are spread out across time.
Next, look at the frequency of each search. Searches that run too often just steal resources from other searches that need to run.
Finally, try to reduce the run-time of your searches. The sooner a search completes the sooner a CPU becomes available and the less likely another search will have to be skipped. In the MC, select Search->Search Activity: Instance and scroll down to "Aggregate Search Runtime". Select "Search name" from the drop-menu to see your longest running searches. Examine each to see if they can be modified to run faster.
If this reply helps you, Karma would be appreciated.
- Mark as New
- Bookmark Message
- Subscribe to Message
- Mute Message
- Subscribe to RSS Feed
- Permalink
- Report Inappropriate Content
You are absolutely right about the active use cases that do not apply to my environment, so I proceeded to deactivate all the related use cases about cloud services
It is clear to me that the cause is many simultaneous searches
Thank you for the information on the monitor and for being as specific as I requested, I am really very grateful
for now I must deactivate other use cases and see if the hardware can be increased.
I'm sorry I can't mark as a solution since I didn't start this thread
- Mark as New
- Bookmark Message
- Subscribe to Message
- Mute Message
- Subscribe to RSS Feed
- Permalink
- Report Inappropriate Content
Hi @splunkcol , you can also use allow_skew feature to help in this situation - searches which are not high priority can be skewed to avoid impacting the schedule of high priority searches.
We also faced the high skipped and continued searches issue and allow_skew worked like a charm. Please read the details on what it does and hot it works to understand if this is something which can help you further.
https://docs.splunk.com/Documentation/Splunk/8.0.5/Report/Skewscheduledreportstarttimes
Nisha
- Mark as New
- Bookmark Message
- Subscribe to Message
- Mute Message
- Subscribe to RSS Feed
- Permalink
- Report Inappropriate Content
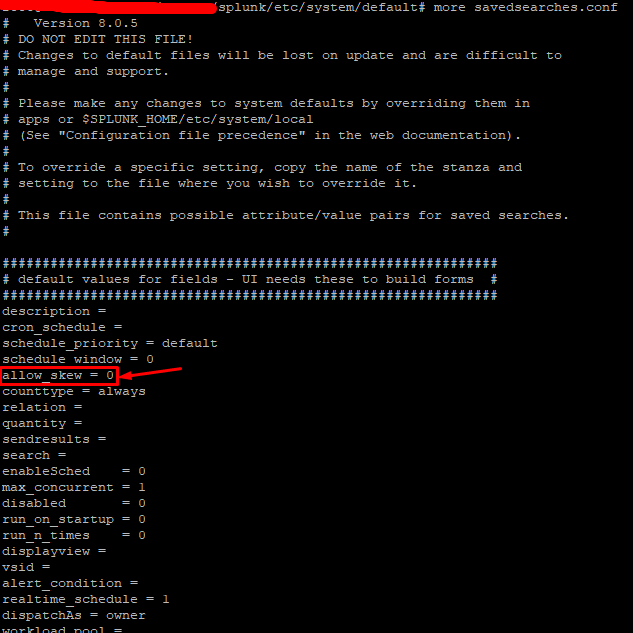
@Nisha18789 I see that by default it is in this way
/splunk/etc/system/default
Now I must go to /splunk/etc/system/default and create a file called savedsearches.conf
allow_skew = 50%
Is this value correct or what do you recommend?
- Mark as New
- Bookmark Message
- Subscribe to Message
- Mute Message
- Subscribe to RSS Feed
- Permalink
- Report Inappropriate Content
hi @splunkcol , sorry for the delay in response.
Regarding the allow_skew value, please be careful, as any value you assign inside system/default will be applied globally and impact all your searches.
For ex- if you set allow_skew=50%, and if there is search which runs every 5 mins, after allow skew it will run any time between 5 +2.5(50% of schedule interval)=7 mins. ---> which might be acceptable
And if a search is running every 24 hours , it can run anywhere between 24+12=32 hours --> which should not be acceptable.
What I am trying to say by this information is that , you should first start with allow_skew on a bunch of searches and see the behaviour to get an idea on how the scheduling changes for those searches. Once you are confident, and you want to implement this globally, you might want to start with a lower value of allow_skew like 5% and monitor your searches and increase/decrease this value based on your findings.
Allow skew is a very good feature but needs to ve used with caution to avoid any delays on searches which are time sensitive and delays in alerting of which are not acceptable by your business.
Hope this helps, let me know if you have any questions.
- Mark as New
- Bookmark Message
- Subscribe to Message
- Mute Message
- Subscribe to RSS Feed
- Permalink
- Report Inappropriate Content
Hello is this solution worked for you?
regards,Shivanand
- Mark as New
- Bookmark Message
- Subscribe to Message
- Mute Message
- Subscribe to RSS Feed
- Permalink
- Report Inappropriate Content
Hello Sir,
this issue has started after the up gradation to 8.0.1.Prior to that there was no issues.is there anything i need to check
- Mark as New
- Bookmark Message
- Subscribe to Message
- Mute Message
- Subscribe to RSS Feed
- Permalink
- Report Inappropriate Content
If this reply helps you, Karma would be appreciated.
- Mark as New
- Bookmark Message
- Subscribe to Message
- Mute Message
- Subscribe to RSS Feed
- Permalink
- Report Inappropriate Content
I still have this issue. I. have the same concern.These errors are appears from cluster captain.


