Turn on suggestions
Auto-suggest helps you quickly narrow down your search results by suggesting possible matches as you type.
Showing results for
Monitoring Splunk
Turn on suggestions
Auto-suggest helps you quickly narrow down your search results by suggesting possible matches as you type.
Showing results for
- Splunk Answers
- :
- Splunk Administration
- :
- Monitoring Splunk
- :
- In Monitoring console where I can find this dashbo...
Options
- Subscribe to RSS Feed
- Mark Topic as New
- Mark Topic as Read
- Float this Topic for Current User
- Bookmark Topic
- Subscribe to Topic
- Mute Topic
- Printer Friendly Page
- Mark as New
- Bookmark Message
- Subscribe to Message
- Mute Message
- Subscribe to RSS Feed
- Permalink
- Report Inappropriate Content
Praz_123
Path Finder
03-05-2024
10:24 PM
Can , anyone help me where can I find the above dashboard in splunk , in Monitoring console.
1 Solution
- Mark as New
- Bookmark Message
- Subscribe to Message
- Mute Message
- Subscribe to RSS Feed
- Permalink
- Report Inappropriate Content
kiran_panchavat
Contributor
03-05-2024
10:45 PM
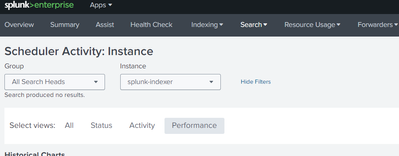
@Praz_123 I can see "Execution Latency Over Time" panel in the "Search > Scheduler Activity:Instance" > Performance in the Splunk Version:9.2.0.1
- Mark as New
- Bookmark Message
- Subscribe to Message
- Mute Message
- Subscribe to RSS Feed
- Permalink
- Report Inappropriate Content
Praz_123
Path Finder
03-05-2024
11:50 PM
@kiran_panchavat , thanks for your help
- Mark as New
- Bookmark Message
- Subscribe to Message
- Mute Message
- Subscribe to RSS Feed
- Permalink
- Report Inappropriate Content
kiran_panchavat
Contributor
03-05-2024
10:45 PM
@Praz_123 I can see "Execution Latency Over Time" panel in the "Search > Scheduler Activity:Instance" > Performance in the Splunk Version:9.2.0.1
Get Updates on the Splunk Community!
Enter the Splunk Community Dashboard Challenge for Your Chance to Win!
The Splunk Community Dashboard Challenge is underway! This is your chance to showcase your skills in creating ...
.conf24 | Session Scheduler is Live!!
.conf24 is happening June 11 - 14 in Las Vegas, and we are thrilled to announce that the conference catalog ...
Introducing the Splunk Community Dashboard Challenge!
Welcome to Splunk Community Dashboard Challenge! This is your chance to showcase your skills in creating ...


