Are you a member of the Splunk Community?
- Find Answers
- :
- Splunk Administration
- :
- Monitoring Splunk
- :
- High CPU Usage of one indexer cluster peer node
- Subscribe to RSS Feed
- Mark Topic as New
- Mark Topic as Read
- Float this Topic for Current User
- Bookmark Topic
- Subscribe to Topic
- Mute Topic
- Printer Friendly Page
- Mark as New
- Bookmark Message
- Subscribe to Message
- Mute Message
- Subscribe to RSS Feed
- Permalink
- Report Inappropriate Content
High CPU Usage of one indexer cluster peer node
Hi community,
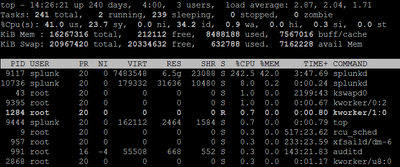
one of our indexer cluster peer nodes has a very high cpu consumption by splunkd process see attached screenshot.
We have an indexer cluster that consists of two peer nodes and one master server. Only one of the peer nodes has this performance issue.
A few Universal Forwarders and Heavy Forwarders get sometimes following timeout from the peer node which has the high load.
08-06-2020 15:02:47.001 +0200 WARN TcpOutputProc - Cooked connection to ip=<ip> timed out
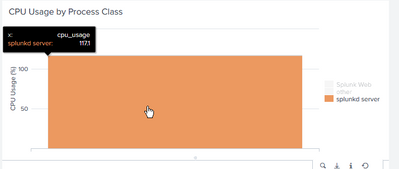
I already looked to the Monitoring Console. In the graph CPU Usage by Process Class i see 117 percent for splunkd server.
But what means splunkd server here?
Where can i get further information to solve this issue?
Thanks for your advice.
kind regards
Kathrin
- Mark as New
- Bookmark Message
- Subscribe to Message
- Mute Message
- Subscribe to RSS Feed
- Permalink
- Report Inappropriate Content
Looks like your indexers are getting overloaded. You may want to consider adding another set of Indexers to distribute the load evenly.
For the CPU utilisation, check the following:
1. Check the status of Indexers' queues. Most likely they'd be blocked due to overload. If yes, then please check the Indexing rate and the amount of data coming in, along with the dats quality. All these factors contribute to high CPU utilisation.
2. Check the values of Noproc and Nofile (ulimit -u and ulimit -n) and consider raising the values. Please post the output here, so that we can have a look as well.
3. Right next to the CPU graph, check for the memory graph as well. What does that tell you? Is the memory mainly consumed by searches or something else? If it's searches, you've got a lot of searched running at the same time, overwhelming your servers.
4. Are the IOPS of your server enough? The incoming load vs how much the server can handle, parse and write to disk also contributes to CPU utilisation.
5. Check if Real time searches are being run in your environment. If yes, please get rid of them. They never end and take a heavy toll on your Indexers.
6. Under search, search - instance, look for top 20 memory consuming searches. Validate them if they are running from a long time and using correct syntax or not. Anything with index=* and All time as timerange also contribute to all this consumption (I ended up disabling real time searches for everyone, all time timestamp for everyone except admins)
7. What are the error messages in splunkd. You may want to look at them as well.
Hope this helps,
S
Shiv
###If you found the answer helpful, kindly consider upvoting/accepting it as the answer as it helps other Splunkers find the solutions to similar issues###


