Are you a member of the Splunk Community?
- Find Answers
- :
- Splunk Administration
- :
- Monitoring Splunk
- :
- Drilldown menu disappearing
- Subscribe to RSS Feed
- Mark Topic as New
- Mark Topic as Read
- Float this Topic for Current User
- Bookmark Topic
- Subscribe to Topic
- Mute Topic
- Printer Friendly Page
- Mark as New
- Bookmark Message
- Subscribe to Message
- Mute Message
- Subscribe to RSS Feed
- Permalink
- Report Inappropriate Content
Drilldown menu disappearing
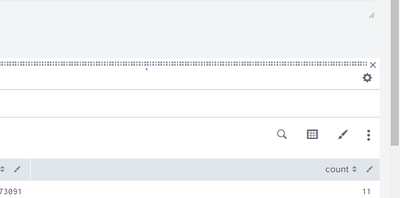
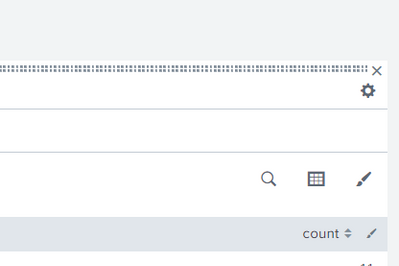
Hi guys I'm having a problem my drilldown menu for the panels on my dashboard is disappearing.
when I render the dashboard its there but when i try to click it it vanishes.
there are no scripts or custom visualizations on the dashboard so I don't understand why this happens. the permissions are also global for the dashboard
- Mark as New
- Bookmark Message
- Subscribe to Message
- Mute Message
- Subscribe to RSS Feed
- Permalink
- Report Inappropriate Content
iirc this is related to the version of splunk you are using.
- Mark as New
- Bookmark Message
- Subscribe to Message
- Mute Message
- Subscribe to RSS Feed
- Permalink
- Report Inappropriate Content
im runnning splunk 8.0.3
- Mark as New
- Bookmark Message
- Subscribe to Message
- Mute Message
- Subscribe to RSS Feed
- Permalink
- Report Inappropriate Content
These on-screen elements are driven by JavaScript. Some browsers/browser features/versions/plugins can interact with them in unexpected ways. Safari's frequent updates is particularly annoying. I had Safari rendering some Web applications very badly. My colleague told me to give browser a clean restart. Sometimes it helps.
It may also help to open a diagnostic tool in the browser. They are often called developer tools, inspector, console, etc. In Safari, you need to set Preferences to allow Develop menu, then select from Develop; in Firefox, it is under Tools -> Web Developer; in Chrome, it is under View -> Developer.
- Mark as New
- Bookmark Message
- Subscribe to Message
- Mute Message
- Subscribe to RSS Feed
- Permalink
- Report Inappropriate Content
Hi.. im also using the same version and having the same issue. Is there any setting which needs to be enabled


